Generate Waveform
Description
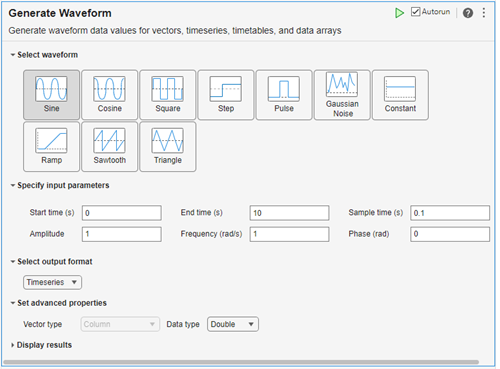
The Generate Waveform task lets you create common waveforms. The task automatically generates MATLAB® code for your live script.
Using this task, you can interactively create data from common waveforms using vectors,
timeseries, timetables, and data arrays. For general
information about Live Editor tasks, see Add Interactive Tasks to a Live Script.
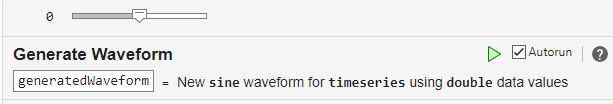
By default, the live task creates a timeseries or
timetable workspace variable, generatedWaveform. You can
use the createdSignal
timeseries or timetable object data in Simulink® or MATLAB. Examples include Root Inport Mapper, Signal Editor, Simulink source blocks, or any application or live task that works with timeseries or timetable objects.
Open the Task
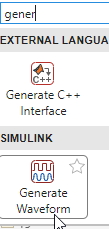
To add the Generate Waveform task to a live script in the MATLAB Editor:
On the Live Editor tab, select Task > Generate Waveform.
In a code block in the script, type a relevant keyword, such as
generate waveform,vector,timeseries,timetable,input,signal,source, orwaveform. From the selected completions, select Generate Waveform.
Examples
This example shows how to use the Generate
Waveform Live Editor task to create numerical data for an inport port
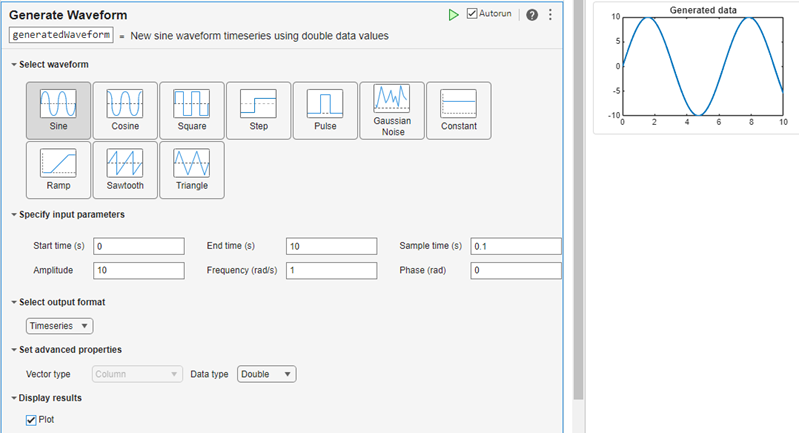
by generating a Sine wave. By default, Generate Waveform
creates a variable named generatedWaveform in the workspace with a
numerical signal type and outputs data in the timeseries format. In
the
Select waveform section, select
Sine.
Set input parameters section, set
Amplitude to 10.
Set output format section, set the format to
Timeseries.
Display results section, click Plot.
To the upper right, a plot of the waveform displays.
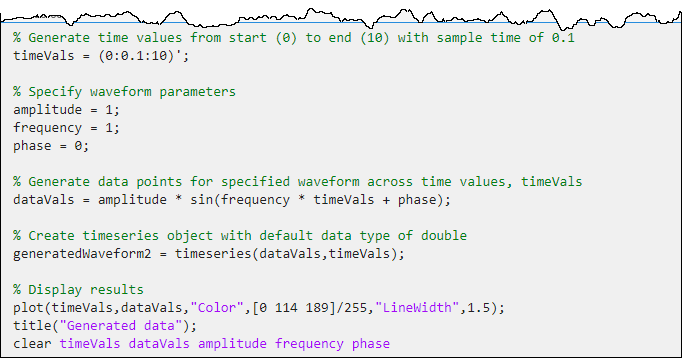
To see the code that this task generates, expand the task display by clicking ![]() at the bottom of the task parameter area.
at the bottom of the task parameter area.
To interactively control waveform parameters, such as the amplitude of the waveform, add a slider to the top of the script. Place the mouse at the top of the live script. In the toolstrip, select Control > Slider. Configure the slider control for the Amplitude parameter.
You can use the generatedWaveform timeseries object data in many
of the cases where you want to input data, for example, to import to Root Inport Mapper
or to work with source blocks. To save this task, save the live script.
This example shows how to use the Generate
Waveform Live Editor task to create numerical data for an inport port
in a model by generating a Cosine waveform. By default, Generate
Waveform creates a variable named generatedWaveform
in the workspace with a numerical signal type and outputs data in the
timeseries format.
Select waveform section, select
Cosine.
Set input parameters section, set
Amplitude to 10.
Set output format section, set the format to
Timeseries.
Display results section, click Plot.
To the upper right, a plot of the waveform displays.

You can use the generatedWaveform timeseries object data in many
of the cases where you want to input data, for example, to import to Root Inport Mapper
or to work with source blocks. To save this task, save the live script.
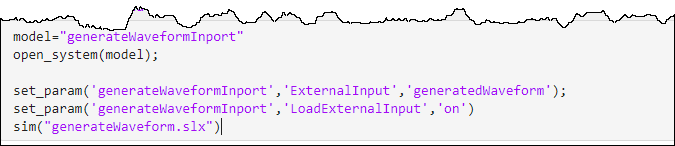
At the bottom of the live task, add the code to open the
CreateSignalInport model, set the
generatedWaveform variable to the input, load the input from the
workspace, and simulate the model.
In the live task, click Run.
In the model, open the Scope block.
Related Examples
Parameters
Version History
Introduced in R2025a