transform
Description
XNormalized = transform(Normalizer,X)X into the normalized data
XNormalized using the incremental normalizer model
Normalizer.
XNormalized = transform(Normalizer,X,ObservationsIn=dim)X along the operating dimension dim.
For example, transform(Normalizer,X,ObservationsIn="columns") specifies
that each column of X contains an observation.
Examples
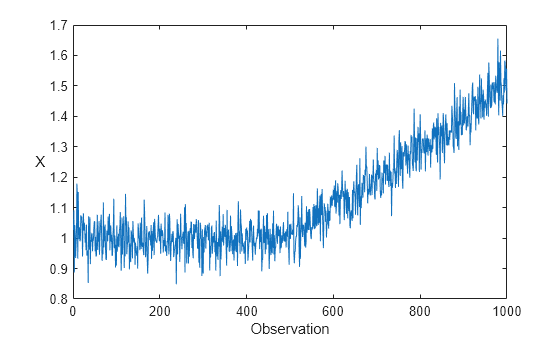
Generate a data set X that contains 1000 observations of a simulated Gaussian noise signal with a standard deviation of 0.05. The signal has an initial mean of 1, which increases linearly after the 500th observation.
rng(0,"twister"); % For reproducibility
n = 1000;
m = 500;
initialMu = 1;
sigma = 0.05;
driftRate = 1/1000;
X = initialMu + sigma*randn(m,1);
t = (1:n-m)';
X = [X; initialMu + t*driftRate + sigma*randn(n-m,1)];
Plot the data set.
plot(X)
xlabel("Observation")
ylabel("X",Rotation=0)
Create Incremental Normalization Model
Create an exponentially weighted incremental normalization model with an initial Center (mean) value of 1 and a Scale (standard deviation) value of 0.05, based on 10 prior observations. Display the properties of the model object.
Normalizer = incrementalNormalizer("exponentiallyweighted", ...
    Center=1,Scale=0.05,NumObservations=10);
details(Normalizer)
  incremental.preprocessing.ExponentiallyWeightedNormalizer with properties:

               SumOfWeights: 10
           ForgettingFactor: 0.0500
                  ScaleData: 1
                     Center: 1
                      Scale: 0.0500
             PredictorNames: "x1"
                     IsWarm: 1
    NumTrainingObservations: 0
              NumPredictors: 1
               WarmupPeriod: 0
             TrainingPeriod: Inf
            UpdateFrequency: 1
      CategoricalPredictors: []

  Methods, Superclasses
Normalizer is an ExponentiallyWeightedNormalizer model object. All its properties are read-only. The properties of Normalizer affect how the software processes chunks of data as follows:
The incremental
fitfunction returns normalized data (IsWarm=true).The
ScaleDatavalue istrue, meaning that the normalized data is centered (mean =0) and scaled (standard deviation =1).fitupdates theCenterandScalevalues of the model each time it processes an observation (UpdateFrequency=1).The value of
ForgettingFactor(0.05) is greater than zero, meaning thatfitassigns higher weight to newer observations.The
TrainingPeriodvalue isInf, meaning that theCenterandScalevalues of the model are never fixed.
Perform Incremental Fitting
To simulate a data stream, process the data in chunks of 50 observations at a time. At each iteration:
Process 50 observations.
If the mean of the data chunk is within one standard deviation of the signal's initial mean, transform the data chunk using the current model. Otherwise, overwrite the previous incremental model with a new one fitted to the incoming observations, and then transform the data chunk using the updated values of
CenterandScale.Store
center, the fittedCentervalue ofNormalizer, to see it evolves during incremental learning.Store
scale, the fittedScalevalue ofNormalizer, to see how it evolves during incremental learning.Store
XNormalized, the normalized data chunk, to see how it evolves during incremental learning.
numObsPerChunk = 50;
nchunk = floor(n/numObsPerChunk);
center = zeros(nchunk,1);
scale = zeros(nchunk,1);
XNormalized = [];
% Incremental normalization
for j = 1:nchunk
    ibegin = min(n,numObsPerChunk*(j-1) + 1);
    iend = min(n,numObsPerChunk*j);
    idx = ibegin:iend;
    chunkMu = mean(X(idx));
    if abs(chunkMu - initialMu) < sigma
        normalized = transform(Normalizer,X(idx));
    else
        [Normalizer,normalized] = fit(Normalizer,X(idx));
    end
    center(j) = Normalizer.Center;
    scale(j) = Normalizer.Scale;
    XNormalized = [XNormalized;normalized];
end
Analyze Incremental Model During Training
To see how the Center and Scale values evolve during training, plot them on separate tiles.
figure
tiledlayout(2,1);
nexttile
plot(center,"o-")
xlabel("Iteration")
ylabel("Center")
nexttile
plot(scale,"o-")
xlabel("Iteration")
ylabel("Scale")
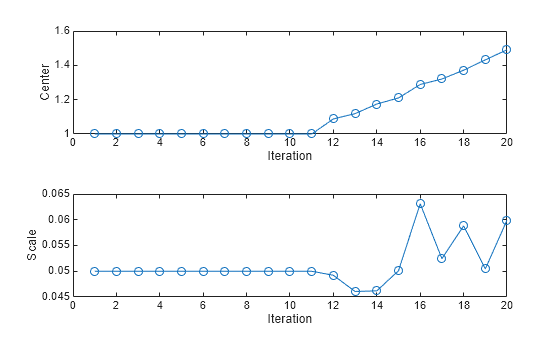
The Center and Scale values closely track the signal's mean and standard deviation values during the first 11 iterations. After the signal's mean starts to drift, the Center value continues to track the signal's mean, and the Scale value fluctuates slightly around the signal's standard deviation value.
Plot the normalized signal data, and then display its mean and standard deviation.
figure
plot(XNormalized)
xlabel("Observation")
ylabel("XNormalized")
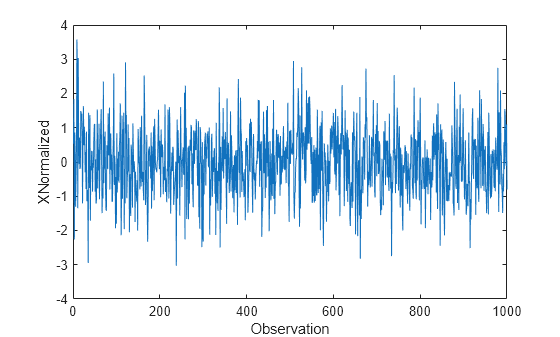
display(mean(XNormalized))
-0.0180
display(std(XNormalized))
0.9880
The normalized signal has a mean close to zero and a standard deviation close to 1.
Input Arguments
Output Arguments
Algorithms
When a value in Normalizer.Scale is 0 or
[], the transform function computes the
z-score values of the corresponding predictor using a standard deviation
value of 1. This behavior matches the behavior of zscore, which computes z-score values using a standard
deviation value of 1 when the input data consists of identical values. The normalize
function always calculates z-scores using the standard deviation of the
input data.
Version History
Introduced in R2026a