maineffectsplot
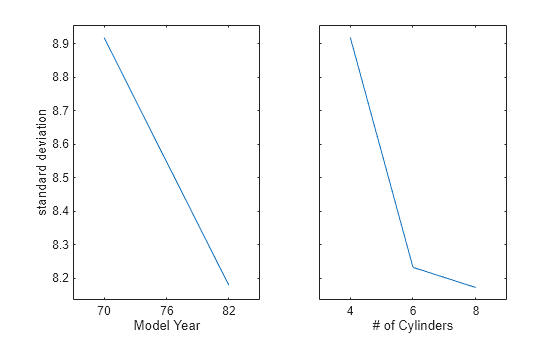
Main effects plot for grouped data
Description
maineffectsplot(
specifies additional options using one or more name-value arguments. For example, you can
specify the grouping variable names, and the statistic to plot.Y,group,Name=Value)
Examples
Input Arguments
Name-Value Arguments
Output Arguments
Version History
Introduced in R2006b

