Predict Out-of-Sample Responses of Subtrees
This example shows how to predict out-of-sample responses of regression trees, and then plot the results.
Load the carsmall data set. Consider Weight as a predictor of the response MPG.
load carsmall
idxNaN = isnan(MPG + Weight);
X = Weight(~idxNaN);
Y = MPG(~idxNaN);
n = numel(X);
Partition the data into training (50%) and validation (50%) sets.
rng(1) % For reproducibility
idxTrn = false(n,1);
idxTrn(randsample(n,round(0.5*n))) = true; % Training set logical indices
idxVal = idxTrn == false;                  % Validation set logical indices
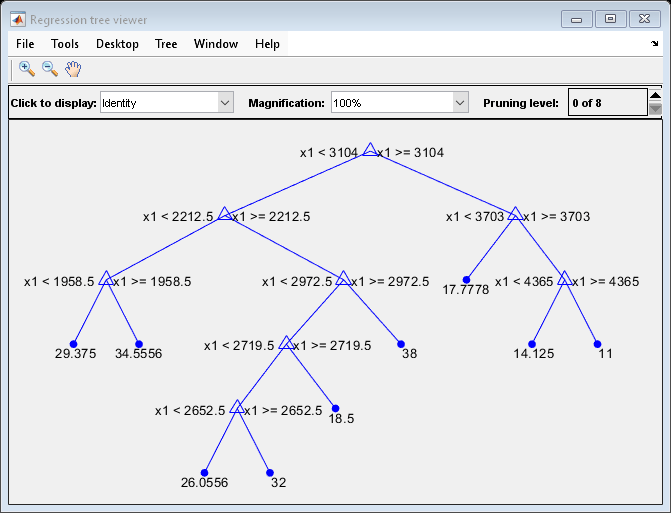
Grow a regression tree using the training observations.
Mdl = fitrtree(X(idxTrn),Y(idxTrn));
view(Mdl,'Mode','graph')
Compute fitted values of the validation observations for each of several subtrees.
m = max(Mdl.PruneList);
pruneLevels = 0:2:m; % Pruning levels to consider
z = numel(pruneLevels);
Yfit = predict(Mdl,X(idxVal),'SubTrees',pruneLevels);
Yfit is an n-by- z matrix of fitted values in which the rows correspond to observations and the columns correspond to a subtree.
Plot Yfit and Y against X.
figure;
sortDat = sortrows([X(idxVal) Y(idxVal) Yfit],1); % Sort all data with respect to X
plot(sortDat(:,1),sortDat(:,2),'*');
hold on;
plot(repmat(sortDat(:,1),1,size(Yfit,2)),sortDat(:,3:end));
lev = cellstr(num2str((pruneLevels)','Level %d MPG'));
legend(['Observed MPG'; lev])
title 'Out-of-Sample Predictions'
xlabel 'Weight (lbs)';
ylabel 'MPG';
h = findobj(gcf);
axis tight;
set(h(4:end),'LineWidth',3) % Widen all lines
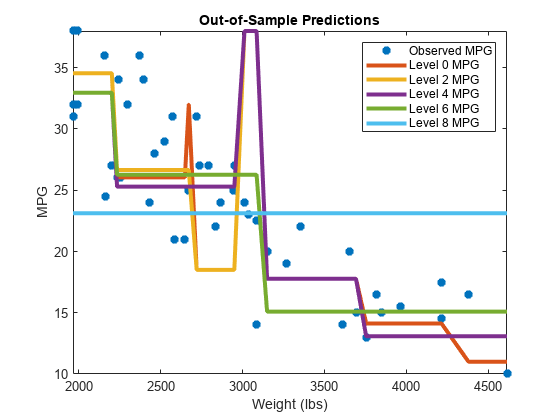
The values of Yfit for lower pruning levels tend to follow the data more closely than higher levels. Higher pruning levels tend to be flat for large X intervals.