plot
Plot data with optional grouping
Description
plot(
plots the
measurements in the repeated measures model rm
)rm
for
each subject as a function of time. If there is a single numeric within-subjects
factor, plot
uses the values of that factor as
the time values. Otherwise, plot
uses the discrete
values 1 through r as the time values, where r is
the number of repeated measurements.
plot(
also
plots the measurements in the repeated measures model rm
,Name,Value
)rm
,
with additional options specified by one or more Name,Value
pair
arguments.
For example, you can specify the factors to group by or change the line colors.
returns
handles, H
= plot(___)H
, to the plotted lines.
Input Arguments
rm
— Repeated measures model
RepeatedMeasuresModel
object
Repeated measures model, returned as a RepeatedMeasuresModel
object.
For properties and methods of this object, see RepeatedMeasuresModel
.
Name-Value Arguments
Specify optional pairs of arguments as
Name1=Value1,...,NameN=ValueN
, where Name
is
the argument name and Value
is the corresponding value.
Name-value arguments must appear after other arguments, but the order of the
pairs does not matter.
Before R2021a, use commas to separate each name and value, and enclose
Name
in quotes.
Group
— Name of between-subject factor or factors
character vector | string array | cell array of character vectors
Name of between-subject factor or factors, specified as the comma-separated pair consisting of
'Group'
and a character vector, string array, or cell array of
character vectors. This name-value pair argument groups the lines according to the
factor values.
For example, if you have two between-subject factors, drug and sex, and you want to group the lines in the plot according to them, you can specify these factors as follows.
Example: 'Group',{'Drug','Sex'}
Data Types: char
| string
| cell
Marker
— Marker to use for each group
string array | cell array of character vectors
Marker to use for each group, specified as the comma-separated pair consisting of
'Marker'
and a string array or cell array of character
vectors.
For example, if you have two between-subject factors, drug and
sex, with each having two groups, you can specify o
as
the marker for the groups of drug and x
as the
marker for the groups of sex as follows.
Example: 'Marker',{'o','o','x','x'}
Data Types: string
| cell
Color
— Color for each group
character vector | string array | cell array of character vectors | rows of a three-column RGB matrix
Color for each group, specified as the comma-separated pair consisting of
'Color'
and a character vector, string array, cell array of
character vectors, or rows of a three-column RGB matrix.
For example, if you have two between-subject factors, drug and sex, with each having two groups, you can specify red as the color for the groups of drug and blue as the color for the groups of sex as follows.
Example: 'Color','rrbb'
Data Types: single
| double
| char
| string
| cell
LineStyle
— Line style for each group
string array | cell array of character vectors
Line style for each group, specified as the comma-separated pair consisting of
'LineStyle'
and a string array or cell array of character
vectors.
For example, if you have two between-subject factors, drug and
sex, with each having two groups, you can specify -
as
the line style of one group and :
as the line style
for the other group as follows.
Example: 'LineStyle',{'-' ':' '-' ':'}
Data Types: string
| cell
Output Arguments
H
— Handle to plotted lines
handle
Handle to plotted lines, returned as a handle.
Examples
Plot Data by Group
Load the sample data.
load fisheriris
The column vector species
consists of iris flowers of three different species: setosa, versicolor, and virginica. The double matrix meas
consists of four types of measurements on the flowers: the length and width of sepals and petals in centimeters, respectively.
Store the data in a table array.
t = table(species,meas(:,1),meas(:,2),meas(:,3),meas(:,4),... 'VariableNames',{'species','meas1','meas2','meas3','meas4'}); Meas = dataset([1 2 3 4]','VarNames',{'Measurements'});
Fit a repeated measures model, where the measurements are the responses and the species is the predictor variable.
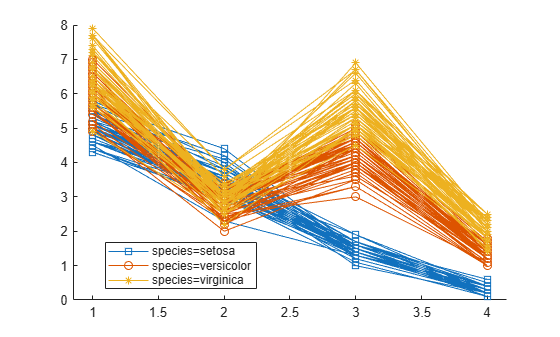
rm = fitrm(t,'meas1-meas4~species','WithinDesign',Meas);
Plot data grouped by the factor species.
plot(rm,'group','species')
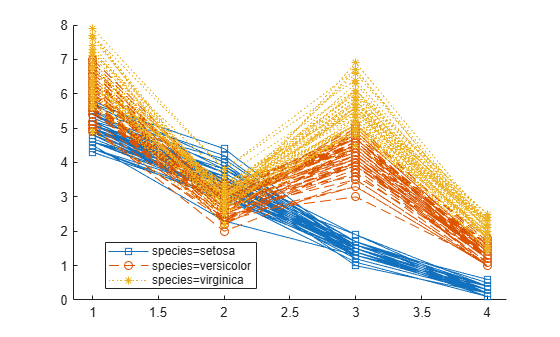
Change the line style for each group.
plot(rm,'group','species','LineStyle',{'-','--',':'})
Plot Data Grouped by Two Factors
Load the sample data.
load repeatedmeas
The table between
includes the between-subject variables age, IQ, group, gender, and eight repeated measures y1
through y8
as responses. The table within
includes the within-subject variables w1
and w2
. This is simulated data.
Fit a repeated measures model, where the repeated measures y1
through y8
are the responses, and age, IQ, group, gender, and the group-gender interaction are the predictor variables. Also specify the within-subject design matrix.
rm = fitrm(between,'y1-y8 ~ Group*Gender + Age + IQ','WithinDesign',within);
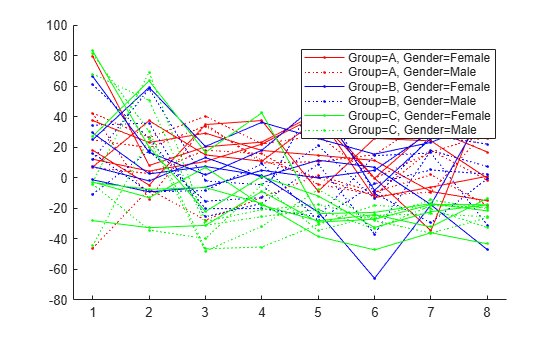
Plot data with Group
coded by color and Gender
coded by line type.
plot(rm,'group',{'Group' 'Gender'},'Color','rrbbgg',... 'LineStyle',{'-' ':' '-' ':' '-' ':'},'Marker','.')
See Also
Apri esempio
Si dispone di una versione modificata di questo esempio. Desideri aprire questo esempio con le tue modifiche?
Comando MATLAB
Hai fatto clic su un collegamento che corrisponde a questo comando MATLAB:
Esegui il comando inserendolo nella finestra di comando MATLAB. I browser web non supportano i comandi MATLAB.
Select a Web Site
Choose a web site to get translated content where available and see local events and offers. Based on your location, we recommend that you select: .
You can also select a web site from the following list:
How to Get Best Site Performance
Select the China site (in Chinese or English) for best site performance. Other MathWorks country sites are not optimized for visits from your location.
Americas
- América Latina (Español)
- Canada (English)
- United States (English)
Europe
- Belgium (English)
- Denmark (English)
- Deutschland (Deutsch)
- España (Español)
- Finland (English)
- France (Français)
- Ireland (English)
- Italia (Italiano)
- Luxembourg (English)
- Netherlands (English)
- Norway (English)
- Österreich (Deutsch)
- Portugal (English)
- Sweden (English)
- Switzerland
- United Kingdom (English)