Response Surface Tool
R2026bInteractive response surface modeling
Description
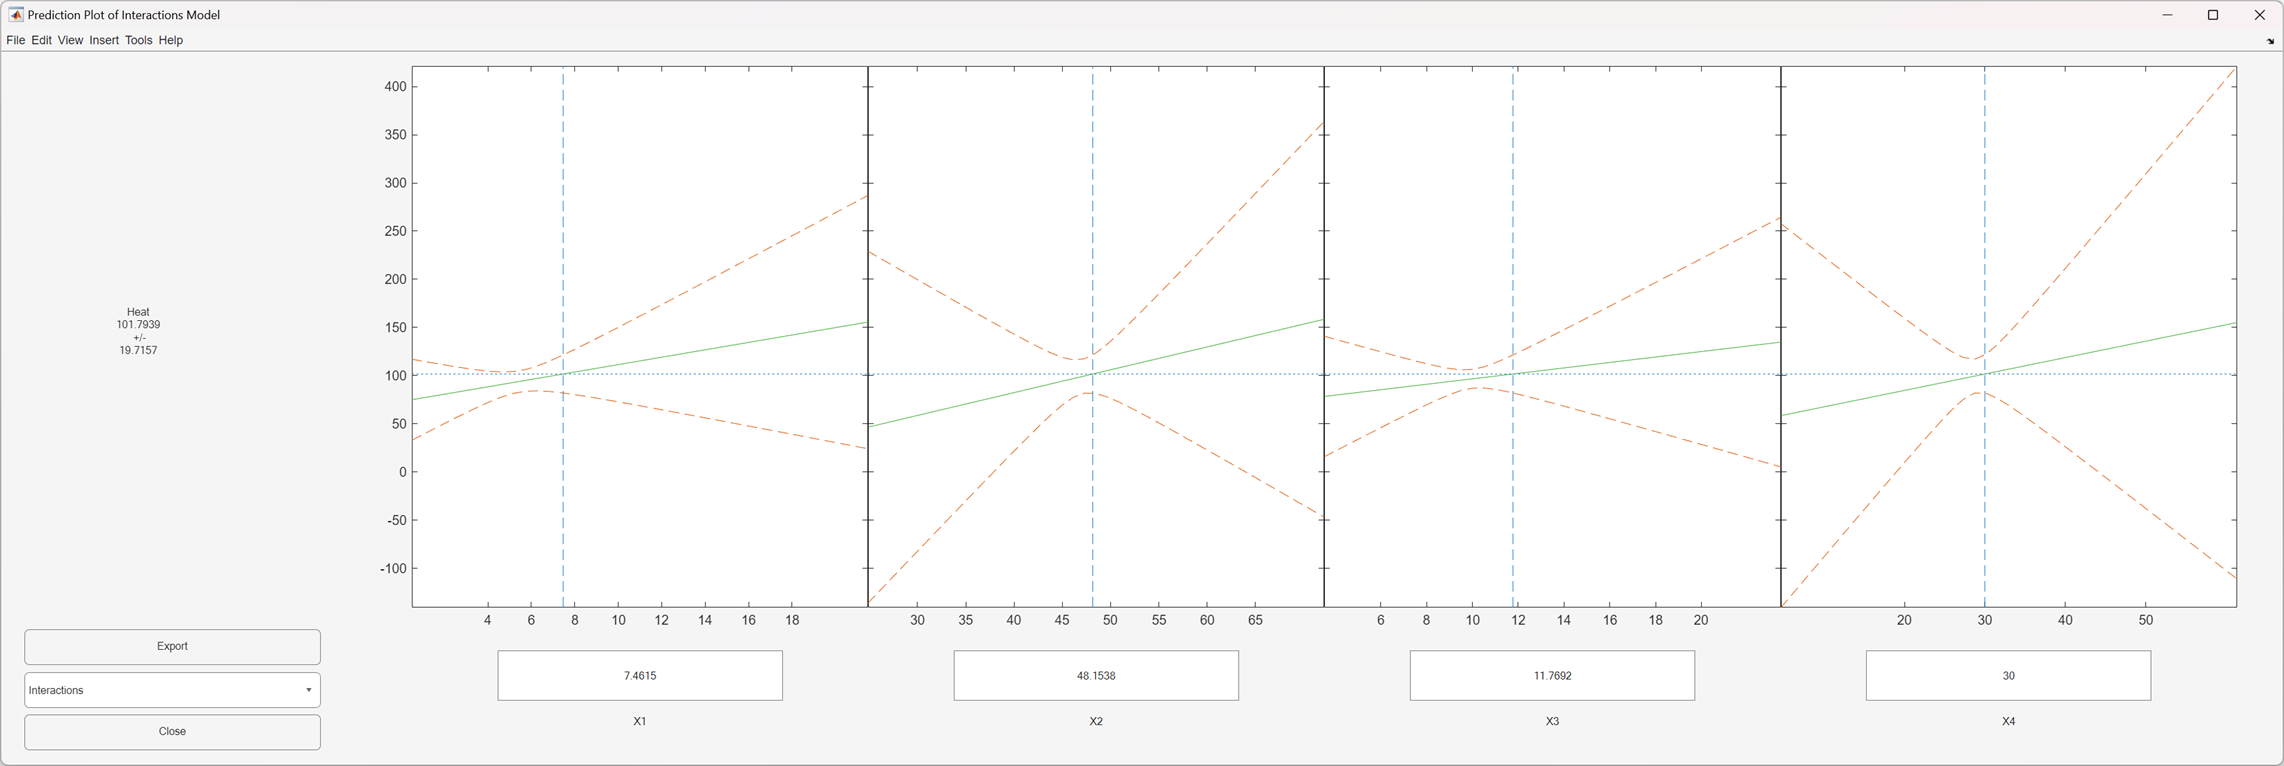
The Response Surface tool allows you to interactively investigate one-dimensional contours of multidimensional response surface models.
By default, the tool opens with the cement mixture data from hald.mat
and a fitted response surface with constant, linear, and interaction terms. A sequence of
plots is displayed, each showing a contour of the response surface against a single predictor,
with all other predictors held fixed. The tool plots a 95% simultaneous confidence band for
the fitted response surface model as two dashed red curves. The text box below each plot
displays the predictor value, which appears as a vertical dotted blue line in the plot. The
corresponding response value, which appears to the left of the plots, is indicated by a
horizontal dashed blue line.
Required Products
MATLAB®
Statistics and Machine Learning Toolbox™
Open the Response Surface Tool
At the MATLAB command prompt, enter
rstool.
Examples
Use the Response Surface tool to visualize a quadratic response surface model of the
3-D chemical reaction data in reaction.mat. Use
100(1-alpha) % simultaneous confidence intervals, and label the
plot axes using xn (the reactant names) and yn
("Reaction Rate").
load reaction
alpha = 0.01; % Significance level
rstool(reactants,rate,"quadratic",alpha,xn,yn)
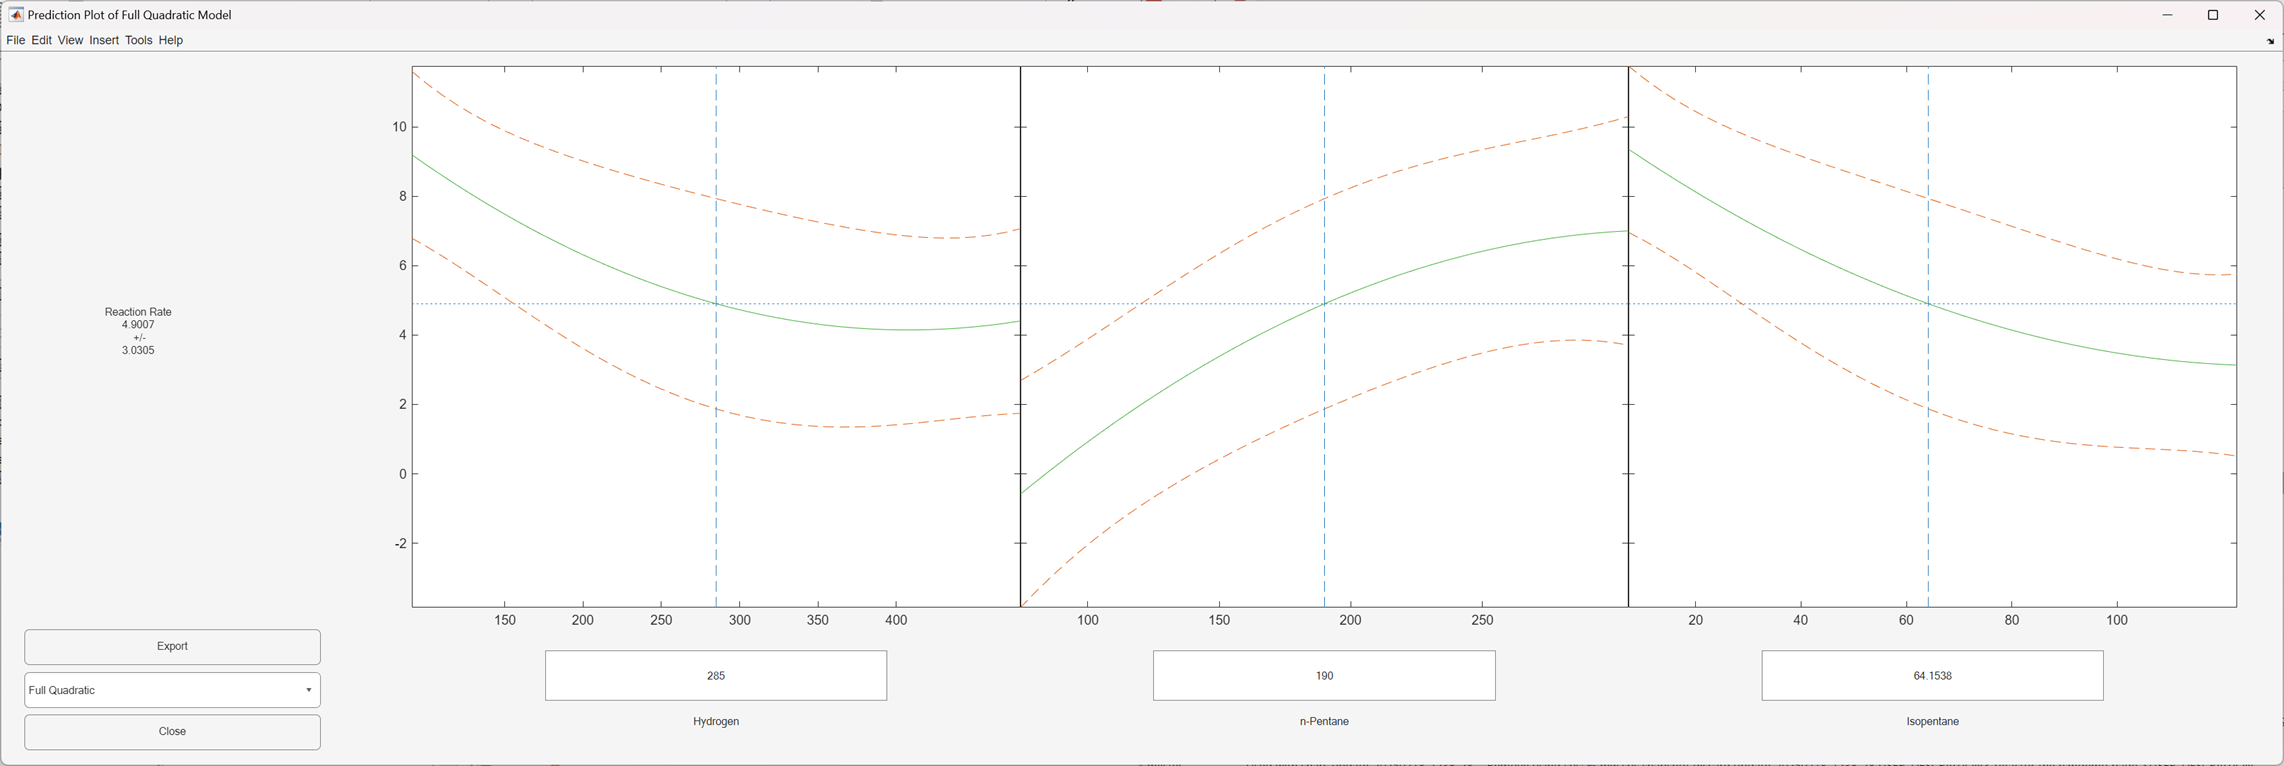
The software displays plots of the fitted response against each predictor. The solid green curve shows the predicted response for that predictor when the other predictor values are fixed. You can change the fixed values by entering new values in the text boxes, or by dragging the vertical lines in the plots to new positions. When you change the value of a predictor, the software updates all plots to display the model at the new point in the predictor space. The dashed red lines indicate the 99% confidence bounds.
The Response Surface tool interface is used by the Response Surface Demonstration Tool to visualize the results of simulated
experiments with data similar to the data in reaction.mat. As
described in Response Surface Designs, the Response Surface
Demonstration Tool uses a response surface model to generate simulated data at
combinations of predictors that are user specified or created by a designed
experiment.
Parameters
Programmatic Use
Tips
Click Export to save information about the fit to MATLAB workspace variables with valid names.
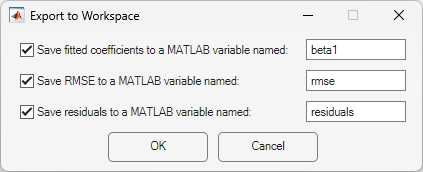
Click OK to close the window.
Version History
Introduced before R2006a

