Tune Pipeline Hyperparameters Using Cross-Validation
This example shows how to use cross-validation to tune hyperparameters in a machine learning pipeline. Create a machine learning pipeline for classification using a tree model. Use cross-validation to select a minimum leaf size that minimizes the classification loss.
Load and Prepare Data
Load the sample data census1994, which contains the adultdata and adulttest data sets. The data sets consist of demographic information from the US Census Bureau that can be used to predict whether an individual earns over $50,000 per year. Preview the first few rows of the adultdata data set.
load census1994
head(adultdata)
age workClass fnlwgt education education_num marital_status occupation relationship race sex capital_gain capital_loss hours_per_week native_country salary
___ ________________ __________ _________ _____________ _____________________ _________________ _____________ _____ ______ ____________ ____________ ______________ ______________ ______
39 State-gov 77516 Bachelors 13 Never-married Adm-clerical Not-in-family White Male 2174 0 40 United-States <=50K
50 Self-emp-not-inc 83311 Bachelors 13 Married-civ-spouse Exec-managerial Husband White Male 0 0 13 United-States <=50K
38 Private 2.1565e+05 HS-grad 9 Divorced Handlers-cleaners Not-in-family White Male 0 0 40 United-States <=50K
53 Private 2.3472e+05 11th 7 Married-civ-spouse Handlers-cleaners Husband Black Male 0 0 40 United-States <=50K
28 Private 3.3841e+05 Bachelors 13 Married-civ-spouse Prof-specialty Wife Black Female 0 0 40 Cuba <=50K
37 Private 2.8458e+05 Masters 14 Married-civ-spouse Exec-managerial Wife White Female 0 0 40 United-States <=50K
49 Private 1.6019e+05 9th 5 Married-spouse-absent Other-service Not-in-family Black Female 0 0 16 Jamaica <=50K
52 Self-emp-not-inc 2.0964e+05 HS-grad 9 Married-civ-spouse Exec-managerial Husband White Male 0 0 45 United-States >50K
The last column of adultdata contains the response variable salary. Save the predictor data in table X and the response variable in table Y.
X = adultdata(:,1:end-1);
Y = table(adultdata.salary);
Specify the predictor data and the response variable in the adulttest test data set as testX and testY, respectively.
testX = adulttest(:,1:end-1);
testY = adulttest.salary;
Create and Visualize Classification Pipeline
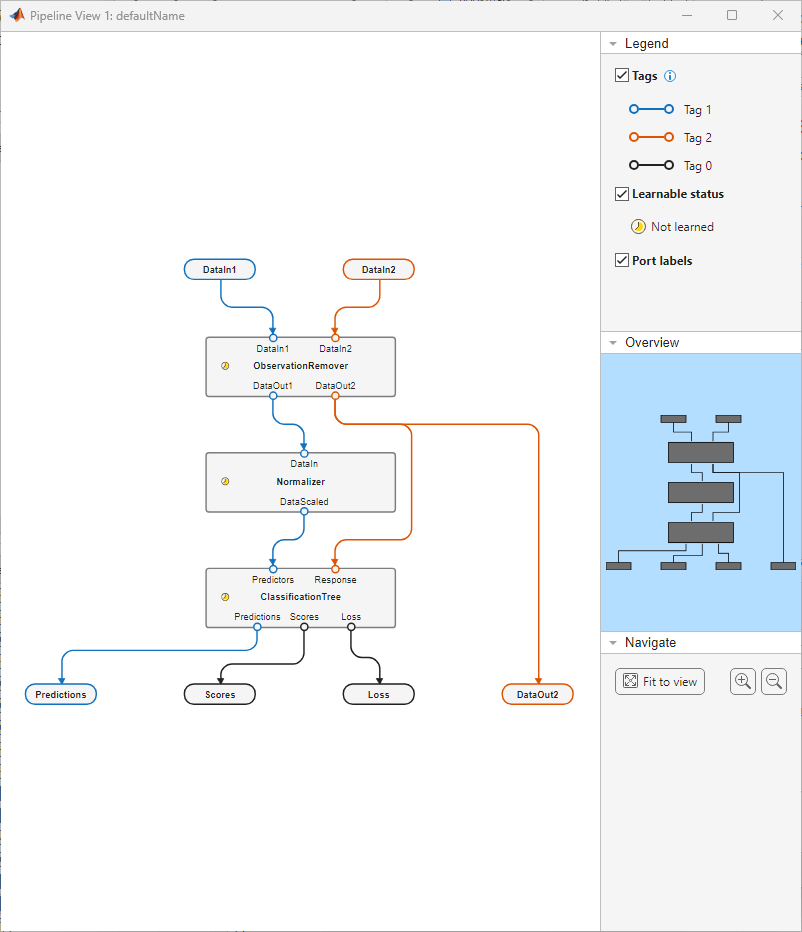
Create a pipeline that removes observations with missing values, normalizes the numeric predictors, and fits a tree classifier. Visualize the pipeline by using the view object function.
pipeline = series(observationRemoverComponent, ...
    normalizerComponent, ...
    classificationTreeComponent);
view(pipeline)
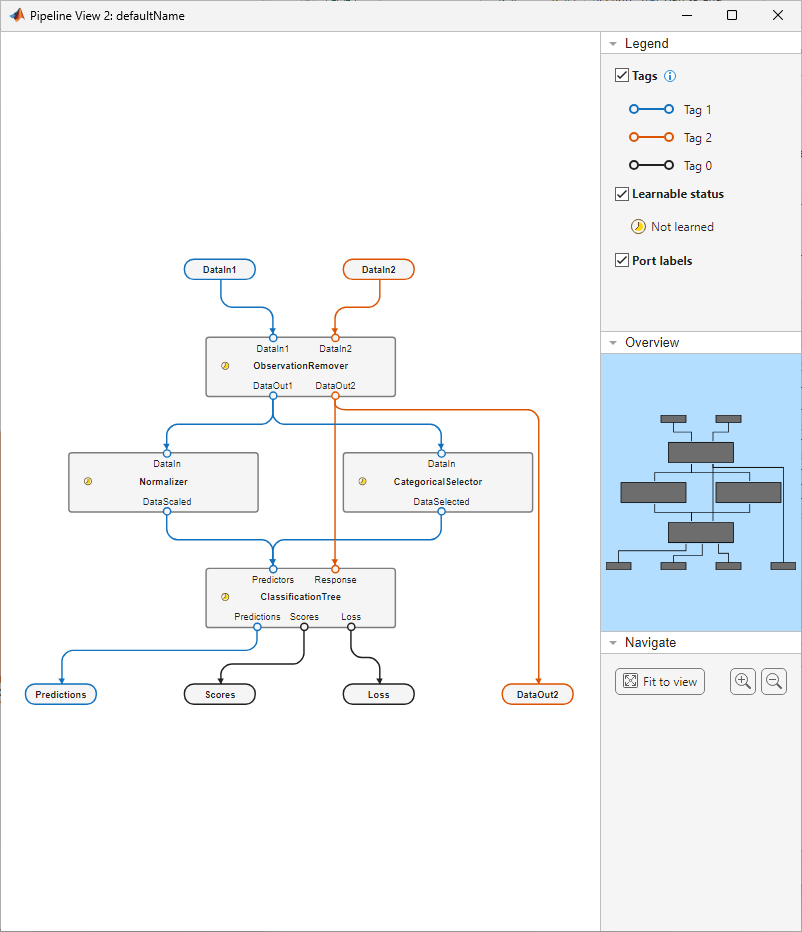
Create a variable selector component to pass the categorical predictors to the ClassificationTree component. The Normalizer component filters out categorical predictors before they reach ClassificationTree. Use the insert function to add the variable selector component to the pipeline between ObservationRemover and ClassificationTree.
variableSelector = variableSelectorComponent(DataType="categorical",Name="CategoricalSelector");
pipeline = insert(pipeline,"ObservationRemover",variableSelector,"ClassificationTree");
view(pipeline)
Cross-Validate Pipeline with Different Hyperparameter Values
The ClassificationTree component uses a minimum leaf size of 1, by default. Determine the performance of the pipeline with the default value by using the crossvalidate function.
Compute the 5-fold cross-validation loss for the pipeline using the training data in X and Y.
rng("default")
crossvalidate(pipeline,X,Y,Kfold=5)
ans = 0.1689
Iterate over 10 possible values for the MinLeafSize property of the ClassificationTree component. At each iteration, increase the minimum leaf size by 20 and perform 5-fold cross-validation. Store the cross-validation loss at each iteration in cvLoss.
for i = 1:10
    pipeline.Components.ClassificationTree.MinLeafSize = i*20;
    cvLoss(i) = crossvalidate(pipeline,X,Y,Kfold=5);
end
Create a table to display the cross-validation loss of each value of MinLeafSize.
cvResults = table([20:20:200]',cvLoss',VariableNames=["MinLeafSize","Loss"])
cvResults=10×2 table
    MinLeafSize     Loss
    ___________    _______

         20         0.1491
         40        0.14677
         60        0.14742
         80        0.14413
        100        0.14342
        120        0.14582
        140         0.1476
        160        0.14938
        180        0.14972
        200        0.14892
Changing the value of MinLeafSize improves pipeline performance compared to the original pipeline. The lowest cross-validation loss occurs with a minimum leaf size of 100.
Train Pipeline and Measure Performance
Change the MinLeafSize property to 100 and use the entire training data set to train the pipeline.
pipeline.Components.ClassificationTree.MinLeafSize = 100;
learnedP = learn(pipeline,X,Y);
Evaluate the performance of learnedP by running the pipeline with the test data set. Include a third output argument testLoss to store the classification loss computed by the pipeline.
[testPred,~,testLoss] = run(learnedP,testX,testY);
testLoss
testLoss =
0.1424
Compare the test set predictions to the true labels by using a confusion matrix. The confusion matrix provides a view of how the pipeline performs at the class level.
confusionchart(testY,testPred.predictions)
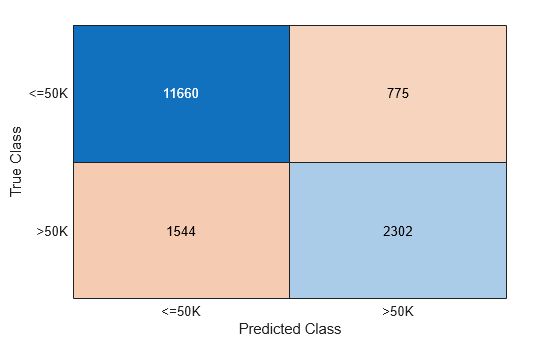
Note that the pipeline performs much better on the <=50K class than the >50K class. This result can be caused by the uneven split of the data between the two classes. You can further modify parameters of the pipeline components to improve performance.