Pin
Description
A pin acts as a buffer for object tokens and directs tokens into or out of an action node. The directionality of the pin represents input or output. You can connect pins by object flows.
These are the two types of input and output pins:
Streaming pins

Non-streaming pins

Action nodes with both types of pins begin execution only once all the input pins hold the minimum number of object tokens. For input pins, once the multiplicity condition is met, the software does not reevaluate the condition until the nested activity restarts. Action nodes with both types of pins terminate only once all the output pins receive at least one token.
Streaming pins and non-streaming pins differ based on how tokens are handled when the action node is executing.
Note
Streaming pins can only be configured for action nodes with a nested activity diagram.
Streaming Pins
Streaming input pins continue to accept and buffer all the tokens that arrive at the pin once the nested activity begins to execute. As the tokens arrive, the software forwards the tokens to the corresponding input parameter node.
Streaming output pins enable the corresponding output parameter nodes to accept and forward incoming tokens. Output parameter nodes can forward the tokens regardless of whether the action is completed.
Non-Streaming Pins
Non-streaming input pins block any incoming object tokens while the action node executes, which causes output object tokens to go into a pending state in the output pins of the previous nodes. If an output pin already has a pending token, any new generated token is discarded. This action is called blocking behavior.
Non-streaming output pins rely on the corresponding output parameter node to hold any incoming tokens. The tokens are forwarded to the output pin only when the action node finishes execution.
Examples
This example shows how you can use an activity diagram containing a nested activity with streaming input pins to model a simple weather station.
Explore the Model
Open the model.
modelname = "weatherforecast_ad";
open_system(modelname);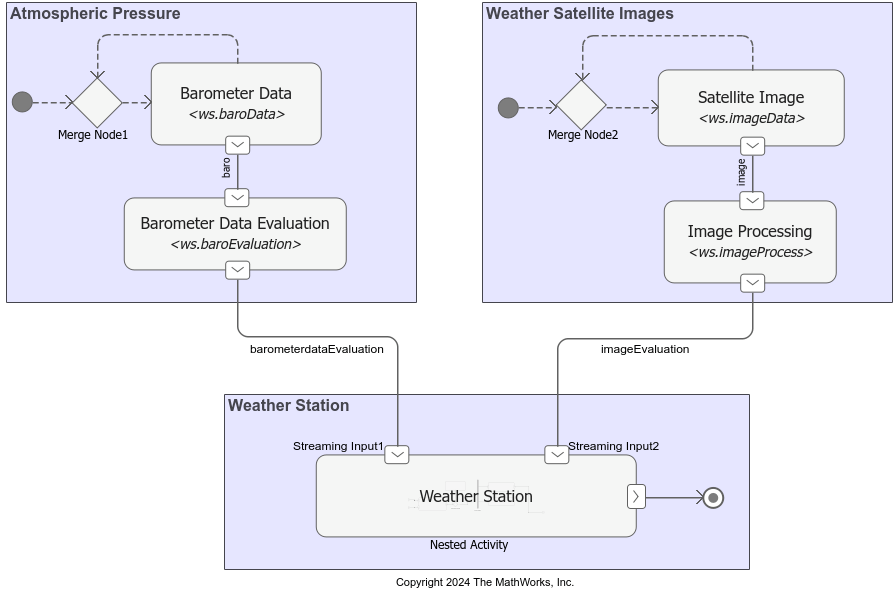
The activity diagram contains three main areas:
Atmospheric Pressure — Simulates generation of barometer readings for a region. The readings indicate the general weather conditions.
Weather Satellite Images — Simulates generation of satellite images over a region. The images display cloud cover that can help predict short-term weather.
Weather Station — Receives atmospheric pressure and image data as input and determines a weather forecast.
The behavior of the action nodes in the activity diagram is dictated by the functions in the MATLAB class file, ws, that is included with the example.
Input Generation for Weather Station
The weather station receives inputs from action nodes in the areas Atmospheric Pressure and Weather Satellite Images.
The Atmospheric Pressure area contains the action node Barometer Data that simulates the continuous generation of barometer readings. After the action node generates a barometer reading, control is passed back to it immediately through a Merge node. The action node generates the next barometer reading, and so on. The next action node, Barometer Data Evaluation, outputs a signal based on different threshold values for the input barometer data.
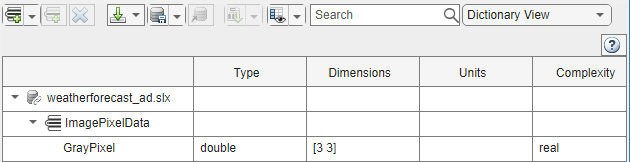
The Weather Satellite Images area contains the action node Satellite Image that simulates continuous generation of grayscale images depicting cloud cover over a certain region. Grayscale images are represented by a 3-by-3 matrix assigned to the structure GrayPixel in the Types Editor.
The next action node, Image Processing, calculates the mean of the grayscale values of the pixels in an image and outputs a signal based on different threshold values for this mean value.
Execution of Weather Station
The Weather Station nested activity in the Weather Station area accepts inputs representing barometer evaluation data and image evaluation data through streaming pins.
The presence of streaming pins allows the nested activity to consume input data while it executes, unlike nonstreaming pins that wait for an action node or nested activity to finish executing for its designated duration.
Streaming pins allow for a nested activity to execute until a desired outcome is achieved, given that the value provided for Stop Time is sufficient. In this example, Weather Station executes until the final weather forecast has a confidence level of 85% or greater, or until the stop time is reached.
In this example, if you use non-streaming pins instead, then the nested activity can execute only one round before it requires more inputs for confidence evaluation (unless the first forecast has high confidence). At this point, non-streaming input pins do not admit more input tokens because the nested activity has not completed execution. Hence, the activity diagram cannot proceed to completion.
The Weather Station nested activity uses its inputs to determine the short-term weather forecast for a region. For example, if the barometer reading is high and the mean of the image pixel values is low, indicating more brightness and less cloudiness, then the weather forecast is Partly Sunny*.*
Each weather forecast is also associated with a confidence level in a structure named ConfidenceLevel. If the generated confidence level is low or medium, then the corresponding forecast is not displayed. If the confidence generated for a forecast is greater than 0.85, then the forecast is considered final. The final forecast is displayed in the Diagnostic Viewer.
The nested activity terminates when it receives a representative object token at its output activity parameter node. The activity diagram also terminates. At this point, any remaining tokens that arrived to the nested activity are destroyed, and the states of all the nodes are reset.
Run the Model
Simulate the model.
sim("weatherforecast_ad"); 0.6557
Confidence Level for Forecast: Low or Medium.
0.0318
Confidence Level for Forecast: Low or Medium.
0.7655
Confidence Level for Forecast: Low or Medium.
0.1626
Confidence Level for Forecast: Low or Medium.
0.8909
Confidence Level: High!
Forecast: Partly Sunny.
To clearly view the flow of tokens, you can slow down the animation speed by changing the Animation speed in the Debug tab.
Parameters
Version History
Introduced in R2024aSee Also
Functions
systemcomposer.createActivity|addNode|addParameter|getNode|getNodes|getFlow|connect|getParameter|getParameters|getPin|getPins|addPin|getParentPin|applyStereotype|removeStereotype|getStereotype|destroy|setBehaviorType
Objects
systemcomposer.activity.Action|systemcomposer.activity.Activity|systemcomposer.activity.ActivityNode|systemcomposer.activity.ActivityFinal|systemcomposer.activity.ControlNode|systemcomposer.activity.Flow|systemcomposer.activity.FlowFinal|systemcomposer.activity.Model|systemcomposer.activity.JoinFork|systemcomposer.activity.Initial|systemcomposer.activity.MergeDecision|systemcomposer.activity.Parameter|systemcomposer.activity.Pin
Tools
Blocks
- Initial Node | Action Node | Parameter Node | Decision or Merge Node | Join or Fork Node | Flow Final Node | Activity Final Node
Topics
- Describe System Behavior Using Activity Diagrams
- Establish Traceability and Extend Model Elements
- Simulate, Visualize, and Validate Activity Diagrams
- Compose Architectures Visually
- Implement Component Behavior Using Activity Diagrams
- Implement Component Behavior Using Stateflow Charts
- Implement Component Behavior Using Simscape