Code Execution Profiling on PX4 Target in Monitor & Tune Simulation
This example shows how to use the UAV Toolbox Support Package for PX4® Autopilots to profile the real-time execution of the generated code running as an executable on a PX4 target hardware with XCP on Serial Interface.
Introduction
Sample times you specify in Simulink® models determine the time schedule for running generated code on target hardware. With enough computing power on the hardware, the code runs in real-time according to the specified sample times. With real-time execution profiling, you can check if the generated code meets your real-time performance requirements. This support package supports the code execution profiling on supported PX4 hardware.
At the end of the Simulink model code profile execution, you can:
View a report of code execution times.
Access and analyze execution time profiling data.
Prerequisite
If you are new to Simulink, watch the Simulink Quick Start video.
Required MathWorks Products
Simulink
Embedded Coder®
Required Hardware
One of these Supported PX4 Autopilots.
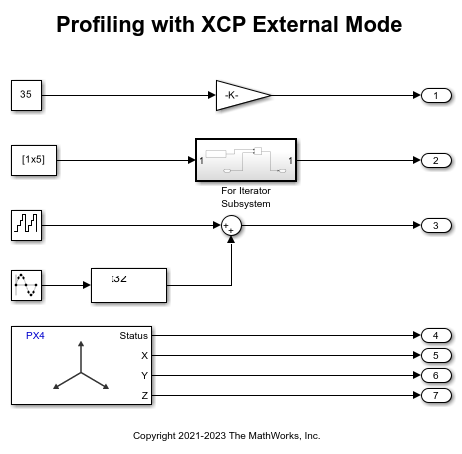
Open Model
Open the preconfigured example model px4demo_profiling.
Configure the Model
In this example, you configure a Simulink model and enable profiling.
Note: These steps are not required in the preconfigured model. Perform these steps if you have changed the hardware or are not using the preconfigured model.
1. Open the Configuration Parameters dialog box. In the Simulink model window toolstrip, select Modeling > Model Settings.
2. Open the Hardware Implementation pane, and set the Hardware board parameter to the required PX4 hardware.
3. Expand Target hardware resources for that board.
4. On the External mode tab, set Communication interface to XCP or Serial.

5. Navigate to Code Generation > Verification > Code execution time profiling and select Measure task execution time.

6. Select the required option for Measure function execution times, Workspace Variable, and Save Options. For information on save options, see Save Options.


7. Click Apply and OK.
Initiate Monitor and Tune Action for the Model
To monitor signals and tune parameters, in the Simulink model window toolstrip, on the Hardware tab, click Monitor & Tune.
This generates a profiling report with profiling metrics of different tasks/functions that are being profiled. This also contains links to plot the data on SDI, bar charts, pie charts and CPU Utilization, which provides further analysis of the data.
All data report

Code Execution Profiling Report Details
This report provides the following details:
A detailed summary
Information about profiled code sections, which includes time measurements
Average and maximum CPU core utilization
CPU Utilization in profiling report is computed by dividing the execution time taken by task by the sample time of the periodic task. This CPU utilization does not consider other PX4 modules to give the actual utilization of the processor.
Definition of metric
The report has these sections:
Section: Name of function from which code is generated
Maximum Execution Time in ns: Longest time between start and end of code section
Average Execution Time in ns: Average time between start and end of code section
Maximum Self Time in ns: Longest execution time, excluding time spent in child sections
Average Self Time in ns: Average execution time, excluding time spent in child sections
Calls: Number of calls to the code section
MATLAB icon: Icon that you click to display the profiled code section
SDI icon: Icon that you click to visualize the profiling data over the duration of simulation

Bar chart icon: Icon that you click to display the normalized frequency of the execution times of the task/function

Pie chart icon: Icon that you click to display the time taken by a function and its child functions

Metrics only report

This report contains only summary metrics of Average/Maximum execution times of each task/function being profiled. Also, it contains the number of times each function/task is called during simulation.
Note: Profiling with All data or Summary data save options and Detailed option selected for Measure function execution times requires high bandwidth. This is because large amount of data must be sent in real-time. If the target does not have enough bandwidth to stream data in real-time, then select Metrics Only save option. Running profiling with this option stores summary profiling data on the target and will only send data to the development computer at the end of simulation.
Other Things to Try
Profile other Simulink models from the UAV Toolbox Support Package for PX4 Autopilots. Observe the time taken for implementing steps in the Simulink model that helps to improve its efficiency.