Engine Calibration Maps
Calibration maps are a key part of the Mapped CI Engine and Mapped SI Engine blocks available in the Vehicle Dynamics Blockset™. Engine models use the maps to represent engine behavior and to store optimal control parameters. Using calibration maps in control design leads to flexible, efficient control algorithms and estimators that are suitable for electronic control unit (ECU) implementation.
To develop the calibration maps for engine plant models in the reference applications, MathWorks® developed and used processes to measure performance data from 1.5–L spark-ignition (SI) and compression-ignition (CI) engine models provided by Gamma Technologies LLC.
To represent the behavior of engine plants specific to your application, you can develop your own engine calibration maps. The data required for calibration typically comes from engine dynamometer tests or engine hardware design models.
Engine Plant Calibration Maps
The engine plant model calibration maps in the Mapped CI Engine and Mapped SI Engine blocks affect the engine response to control inputs (for example, spark timing, throttle position, and cam phasing).
To develop the calibration maps in the engine plant models, MathWorks used GT-POWER models from the GT-SUITE modeling library in a Simulink®-based virtual dynamometer. MathWorks used the Model-Based Calibration Toolbox™ to create design-of-experiment (DoE) test plans. The Simulink-based virtual dynamometer executed the DoE test plan on GT-POWER 1.5–L SI and CI reference engines. MathWorks used the Model-Based Calibration Toolbox to develop the engine plant model calibration maps from the GT-POWER.
Calibration Maps in the Mapped CI Engine Block
The Mapped CI Engine block implements these calibration maps.
| Map | Used For | In | Description |
|---|---|---|---|
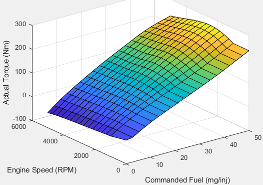
| Engine brake torque | Engine brake torque as a function of commanded fuel mass and engine speed | Mapped CI Engine |
The engine brake torque lookup table is a function of commanded fuel mass and engine speed, = ƒ(F, N), where:
|
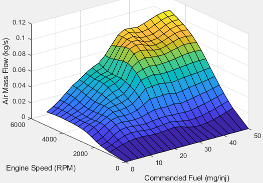
| Engine air mass flow | Engine air mass flow as a function of commanded fuel mass and engine speed | Mapped CI Engine |
The air mass flow lookup table is a function of commanded fuel mass and engine speed, = ƒ(Fmax, N), where:
|
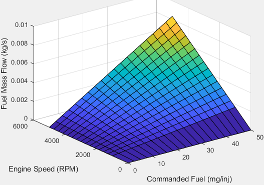
| Engine fuel flow | Engine fuel flow as a function of commanded fuel mass and engine speed | Mapped CI Engine |
The engine fuel flow lookup table is a function of commanded fuel mass and engine speed, MassFlow= ƒ(F, N), where:
|
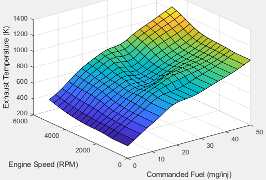
| Engine exhaust temperature | Engine exhaust temperature as a function of commanded fuel mass and engine speed | Mapped CI Engine |
The engine exhaust temperature table is a function of commanded fuel mass and engine speed, Texh= ƒ(F, N), where:
|
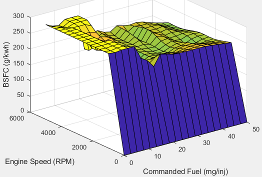
| Brake-specific fuel consumption (BSFC) efficiency | BSFC efficiency as a function of commanded fuel mass and engine speed | Mapped CI Engine |
The brake-specific fuel consumption (BSFC) efficiency is a function of commanded fuel mass and engine speed, BSFC= ƒ(F, N), where:
|
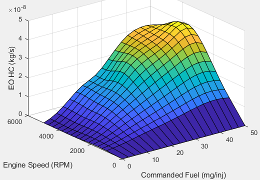
| Engine-out (EO) hydrocarbon emissions | EO hydrocarbon emissions as a function of commanded fuel mass and engine speed | Mapped CI Engine |
The engine-out hydrocarbon emissions are a function of commanded fuel mass and engine speed, EO HC= ƒ(F, N), where:
|
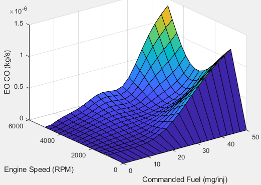
| Engine-out (EO) carbon monoxide emissions | EO carbon monoxide emissions as a function of commanded fuel mass and engine speed | Mapped CI Engine |
The engine-out carbon monoxide emissions are a function of commanded fuel mass and engine speed, EO CO= ƒ(F, N), where:
|
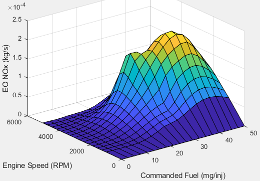
| Engine-out (EO) nitric oxide and nitrogen dioxide | EO nitric oxide and nitrogen dioxide emissions as a function of commanded fuel mass and engine speed | Mapped CI Engine |
The engine-out nitric oxide and nitrogen dioxide emissions are a function of commanded fuel mass and engine speed, EO NOx= ƒ(F, N), where:
|
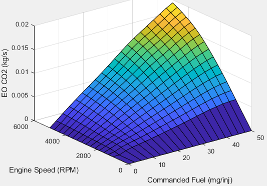
| Engine-out (EO) carbon dioxide emissions | EO carbon dioxide emissions as a function of commanded fuel mass and engine speed | Mapped CI Engine |
The engine-out carbon dioxide emissions are a function of commanded fuel mass and engine speed, EO CO2= ƒ(F, N), where:
|
Calibration Maps in the Mapped SI Engine Block
The Mapped SI Engine block implements these calibration maps.
| Map | Used For | In | Description |
|---|---|---|---|
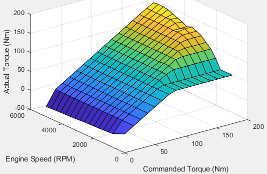
| Engine torque | Engine brake torque as a function of commanded torque and engine speed | Mapped SI Engine |
The engine torque lookup table is a function of commanded engine torque and engine speed, T = ƒ(Tcmd, N), where:
|
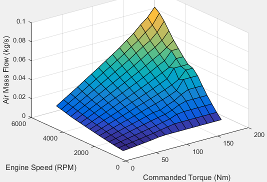
| Engine air mass flow | Engine air mass flow as a function of commanded torque and engine speed | Mapped SI Engine |
The engine air mass flow lookup table is a function of commanded engine torque and engine speed, = ƒ(Tcmd, N), where:
|
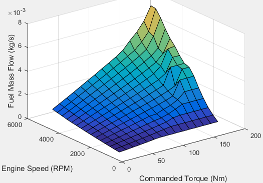
| Engine fuel flow | Engine fuel flow as a function of commanded torque mass and engine speed | Mapped SI Engine |
The engine fuel mass flow lookup table is a function of commanded engine torque and engine speed, MassFlow = ƒ(Tcmd, N), where:
|
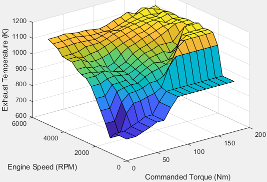
| Engine exhaust temperature | Engine exhaust temperature as a function of commanded torque and engine speed | Mapped SI Engine |
The engine exhaust temperature lookup table is a function of commanded engine torque and engine speed, Texh = ƒ(Tcmd, N), where:
|
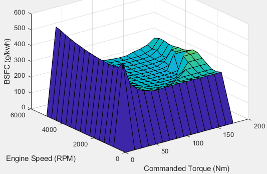
| Brake-specific fuel consumption (BSFC) efficiency | Brake-specific fuel consumption (BSFC) as a function of commanded torque and engine speed | Mapped SI Engine |
The brake-specific fuel consumption (BSFC) efficiency is a function of commanded engine torque and engine speed, BSFC = ƒ(Tcmd, N), where:
|
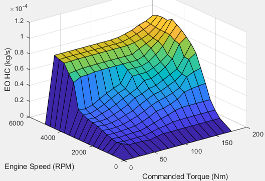
| Engine-out (EO) hydrocarbon emissions | EO hydrocarbon emissions as a function of commanded torque and engine speed | Mapped SI Engine |
The engine-out hydrocarbon emissions are a function of commanded engine torque and engine speed, EO HC = ƒ(Tcmd, N), where:
|
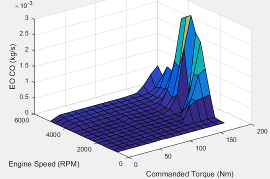
| Engine-out (EO) carbon monoxide emissions | EO carbon monoxide emissions as a function of commanded torque and engine speed | Mapped SI Engine |
The engine-out carbon monoxide emissions are a function of commanded engine torque and engine speed, EO CO = ƒ(Tcmd, N), where:
|
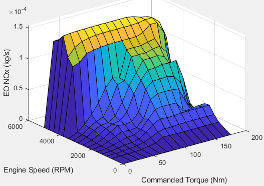
| Engine-out (EO) nitric oxide and nitrogen dioxide emissions | EO nitric oxide and nitrogen dioxide emissions as a function of commanded torque and engine speed | Mapped SI Engine |
The engine-out nitric oxide and nitrogen dioxide emissions are a function of commanded engine torque and engine speed, EO NOx = ƒ(Tcmd, N), where:
|
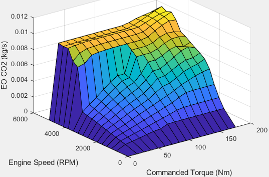
| Engine-out (EO) carbon dioxide emissions | EO carbon dioxide emissions as a function of commanded torque and engine speed | Mapped SI Engine |
The engine-out carbon dioxide emissions are a function of commanded engine torque and engine speed, EO CO2 = ƒ(Tcmd, N), where:
|
See Also
Mapped CI Engine | Mapped SI Engine