plotDetectionSignals
Description
plotDetectionSignals(
plots the energy detection signals while detecting live data of length
ed,length)length from the air using the energy detector
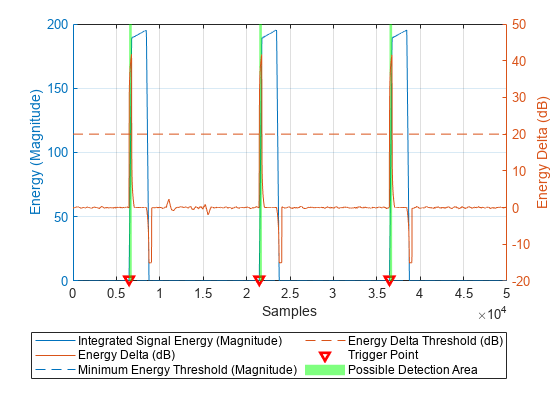
ed. The plot shows the integrated signal energy, the energy delta in dB
between adjacent integration windows, the thresholds, and trigger points of the detection.
Use the displayed information to calibrate the thresholds of the energy detector for
triggering.
droppedSamples = plotDetectionSignals(ed,length)
Examples
Create and configure an energy detector object, specifying a radio setup configuration previously saved in the Radio Setup wizard.
ed = energyDetector("MyRadio")ed =
energyDetector with properties:
Antennas: "RF0:RX2"
CenterFrequency: 2.4000e+09
SampleRate: 250000000
RadioGain: 10
CaptureDataType: "int16"
WindowLength: 300
TriggerOffset: 0
DroppedSamplesAction: "error"
ThresholdMethod: "adaptive"
MinimumEnergy: 1.0000e-04
EnergyDeltaThreshold: 1
ed.SampleRate = 30.72e6;
ed.CenterFrequency = 2.45e9;
ed.RadioGain = 30;
Set the energy increase threshold to 20 dB and the minimum energy to 0.1.
ed.EnergyDeltaThreshold = 20;
ed.MinimumEnergy = 0.1;
Generate a test waveform for detection.
chirpSignal = single(chirp(0:1/1e3:2,0,0.5,15,'complex')).';
chirpSignal(end) = [];
PadLen = 6500;
zeroSignal = complex(zeros(PadLen,1),zeros(PadLen,1));
testWaveform = [zeroSignal; chirpSignal*0.999; zeroSignal];
Send the test waveform continuously.
transmit(ed,testWaveform,"continuous", ...
    TransmitGain=30);
Loading bitstream to FPGA...
Loading bitstream to FPGA is now complete.
Plot the specified number of samples of the signal energy. Use the displayed information to calibrate the thresholding parameters.
plotDetectionSignals(ed,50000);
Input Arguments
Output Arguments
Version History
Introduced in R2023b