First I'd get a first shot at the mask by thresholding. Luckily much of the surround is white so thresholding will get the bottom and sides. Then I might try a texture filter, like stdfilt(), because you know your object of interest is rough while the curved bars/rods behind it are smooth. Then threshold that texture mask and AND it with your intensity thresholding mask. If that doesn't work, post the code for it and we can start tweaking it.
Image Edge Detection Using Edge Function
16 visualizzazioni (ultimi 30 giorni)
Mostra commenti meno recenti
I would like to detect edges in the image in the attached TestImage.jpg. I've highlighted my region of interest in (ROI.jpg). I would not like to use a fixed ROI matrix as different images may not always fit the mask. So I would like to do some edge detection to automatically detect my ROI. I've tried the following:
% Read image as gray scale
I = rgb2gray(imread('TestImage.jpg'));
I = im2double(I);
BW = edge(I,'Canny',0.75,sqrt(150));
image(BW,'CDataMapping','scaled')
The results (DetectedEdges.jpg) does not seem to resolve all the edges I require. I've tried different threshold values as well. Is there a better way of getting my ROI?
0 Commenti
Risposta accettata
Image Analyst
il 7 Feb 2020
9 Commenti

Image Analyst
il 9 Feb 2020
Modificato: Image Analyst
il 9 Feb 2020
Well at least if you can get a slightly larger mask, that would help. You could use that ot get rid of 90% of the clutter and then refine it from there. Definitely see if you can lock down everything as tight as you can. Consult your professional machine shop if you need help.
I don't think you would need to do segmentation in two different color spaces. Doing it in HSV color space alone should be fine. Whatever you do in RGB colorspace you could do probably easier in HSV color space.
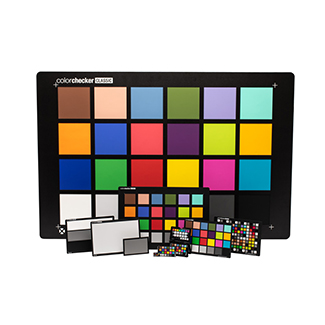
You'll also want to calibrate your system. That means putting in an x-rite Color Checker Chart so that you can get calibrated and consistent HSV values and not have them change every time the lighting changes. And of course have controlled lighting, preferably in a concealed light booth where your scene is not subject to ambient lighting changes in the lab or factory.
By the way, I think you attached the wrong images. The image of the hat looks nothing like the image of that metal bar, or whatever it is, that you attached in your original post.
Più risposte (1)
Rajith
il 19 Nov 2023
function out = edgy(in)
% Get the size of the input image
[r, c] = size(in);
% Create an output array that is two rows and columns smaller
out = zeros(r-2,c-2);
% Use the size of the new array for looping
[r, c] = size(out);
% Convert to double for doing calculations
in = double(in);
% Create the horizontal and vertical edge detector filters
ex = [-1 0 1; -2 0 2; -1 0 1];
ey = [1 2 1; 0 0 0; -1 -2 -1];
for ii = 1:r
for jj = 1:c
sx = in(ii:ii+2,jj:jj+2) .* ex;
sy = in(ii:ii+2,jj:jj+2) .* ey;
% Calculate the output pixel value
out(ii,jj) = sqrt(sum(sum(sx(:)))^2 + sum(sum(sy(:)))^2);
end
end
% Convert back to uint8
out = uint8(out);
end
0 Commenti
Vedere anche
Prodotti
Community Treasure Hunt
Find the treasures in MATLAB Central and discover how the community can help you!
Start Hunting!
Translated by ![]()
Puoi anche selezionare un sito web dal seguente elenco:
Americhe
- América Latina (Español)
- Canada (English)
- United States (English)
Europa
- Belgium (English)
- Denmark (English)
- Deutschland (Deutsch)
- España (Español)
- Finland (English)
- France (Français)
- Ireland (English)
- Italia (Italiano)
- Luxembourg (English)
- Netherlands (English)
- Norway (English)
- Österreich (Deutsch)
- Portugal (English)
- Sweden (English)
- Switzerland
- United Kingdom(English)
Asia-Pacifico
- Australia (English)
- India (English)
- New Zealand (English)
- 中国
- 日本Japanese (日本語)
- 한국Korean (한국어)