
Q_band_ZB_3dplot

Q_band_ZB_3dplot
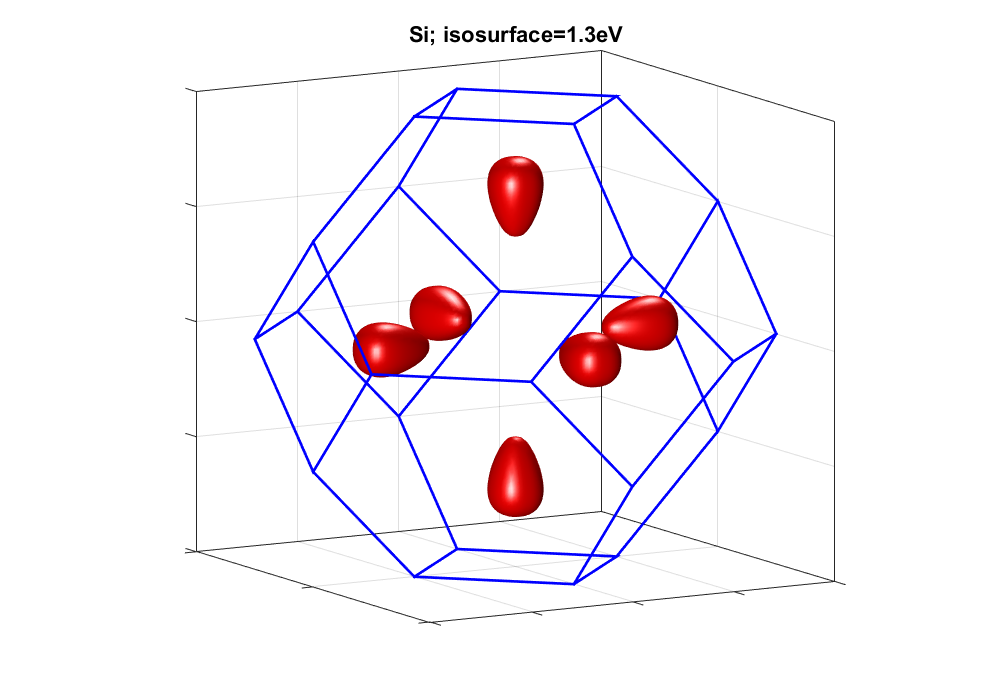
Computes and plot the electrons distribution in the ZB Brillouin zone
It uses the tight-binding model sp3s* where the parameters a from the following references:
-> for the III-V: KLIMECK et al, Superlattices and Microstructures, Vol. 27, No. 5/6, 2000
-> for Si: KLIMECK et al, Superlattices and Microstructures, Vol. 27, No. 2/3,2000
-> for Ge: VOGL et al, I. Phys. Chom. Solids Vol. 44, No. 5. pp. 365-378, 1983


Cita come
Laurent NEVOU (2025). Q_band_ZB_3dplot (https://github.com/LaurentNevou/Q_band_ZB_3dplot), GitHub. Recuperato .
Compatibilità della release di MATLAB
Compatibilità della piattaforma
Windows macOS LinuxTag
Community Treasure Hunt
Find the treasures in MATLAB Central and discover how the community can help you!
Start Hunting!Scopri Live Editor
Crea script con codice, output e testo formattato in un unico documento eseguibile.
Le versioni che utilizzano il ramo predefinito di GitHub non possono essere scaricate
| Versione | Pubblicato | Note della release | |
|---|---|---|---|
| 1.0.1 | image updated |
|
|
| 1.0.0 |
|
Puoi anche selezionare un sito web dal seguente elenco:
Americhe
- América Latina (Español)
- Canada (English)
- United States (English)
Europa
- Belgium (English)
- Denmark (English)
- Deutschland (Deutsch)
- España (Español)
- Finland (English)
- France (Français)
- Ireland (English)
- Italia (Italiano)
- Luxembourg (English)
- Netherlands (English)
- Norway (English)
- Österreich (Deutsch)
- Portugal (English)
- Sweden (English)
- Switzerland
- United Kingdom(English)
Asia-Pacifico
- Australia (English)
- India (English)
- New Zealand (English)
- 中国
- 日本Japanese (日本語)
- 한국Korean (한국어)