
Al momento, stai seguendo questo contributo
- Vedrai gli aggiornamenti nel tuo feed del contenuto seguito
- Potresti ricevere delle email a seconda delle tue preferenze per le comunicazioni
Cita come
Adam Aitkenhead (2026). Plot a 3D array using patch (https://it.mathworks.com/matlabcentral/fileexchange/28497-plot-a-3d-array-using-patch), MATLAB Central File Exchange. Recuperato .
Riconoscimenti
Ispirato: Spectral Imaging Toolbox
Informazioni generali
- Versione (197 KB)
Compatibilità della release di MATLAB
- Compatibile con qualsiasi release
Compatibilità della piattaforma
- Windows
- macOS
- Linux
| Versione | Pubblicato | Note della release | Action |
|---|---|---|---|
| 1.11.0 | The user can now define the lower and upper limits of the colorbar using the input parameter 'clim'. Also, the input flag 'sym' has been removed as this can be done using clim instead. |
||
| 1.9.0 | Provide the handle to the colorbar as an optional output. |
||
| 1.8.0 | Some minor code optimisations |
||
| 1.7.0 | Bugfix: Prevent a hole from appearing at the lowest values in a full colour plot. |
||
| 1.5.0 | The user can now specify the colour map for the display of a 3D numeric array. |
||
| 1.4.0 | Minor bugfix |
||
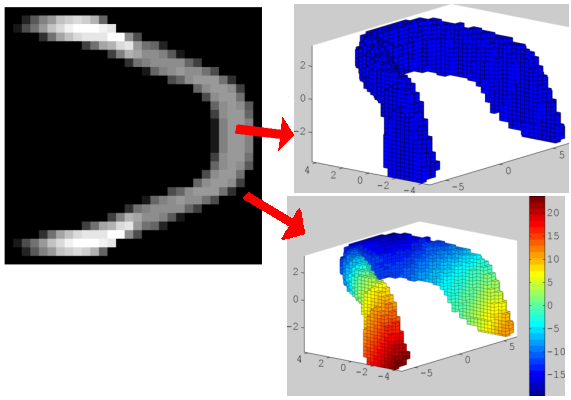
| 1.3.0 | Now enables a 3D numeric array to be plotted such that each facet corresponds to the value of each voxel in the array. |
||
| 1.2.0 | Added missing example.mat file |
||
| 1.1.0 | Improved documentation |
||
| 1.0.0 |

