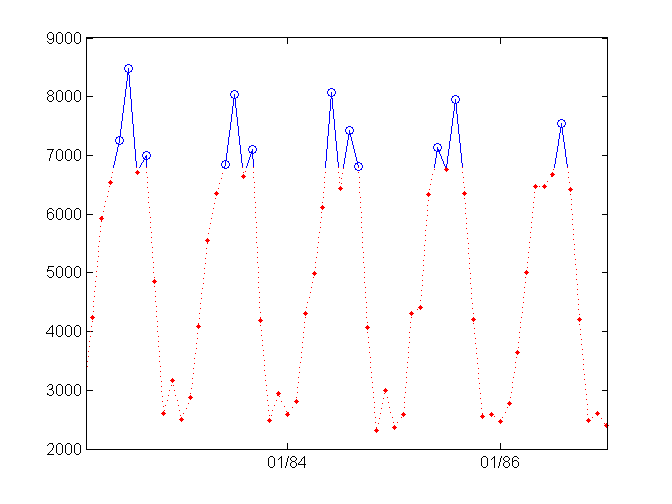
Conditionally colored line plot
Plots (2D line) graph split into two colors above and below a given threshold value

Al momento, stai seguendo questo contributo
- Vedrai gli aggiornamenti nel tuo feed del contenuto seguito
- Potresti ricevere delle email a seconda delle tue preferenze per le comunicazioni
Cita come
Matt Tearle (2026). Conditionally colored line plot (https://it.mathworks.com/matlabcentral/fileexchange/30423-conditionally-colored-line-plot), MATLAB Central File Exchange. Recuperato .
Riconoscimenti
Ispirato: Conditionally Colored Plot (CCPLOT)
Informazioni generali
- Versione (3,77 KB)
Compatibilità della release di MATLAB
- Compatibile con qualsiasi release
Compatibilità della piattaforma
- Windows
- macOS
- Linux
| Versione | Pubblicato | Note della release | Action |
|---|---|---|---|
| 1.1.0 | Made a quick hack to the input-parsing utility to deal with the change in precedence rules. It should now work in 19b and in previous versions. Hasn't been really thoroughly tested, though, so please report any problems. |
||
| 1.0.0 | Updated license |
||
| 1.0.0-0 |

