
Fatigue Damage Accumulation
Fatigue damage accumulation for variable amplitude stress-time histories using the Palmgren-Miner rule.
Al momento, stai seguendo questo contributo
- Vedrai gli aggiornamenti nel tuo feed del contenuto seguito
- Potresti ricevere delle email a seconda delle tue preferenze per le comunicazioni
Fatigue-Damage-Accumulation
By C. Souto (csouto@fe.up.pt)
If you use this work, please cite the following reference
C. Souto, J. Correia, A. de Jesus, R. Calçada, Fatigue Damage Tool (FDT) - A tool for fatigue damage assessment according to design codes, Procedia Structural Integrity 22 (2019) 376-385. doi:10.1016/j.prostr.2020.01.047.
Description
Fatigue damage accumulation for variable amplitude stress-time histories using the Palmgren-Miner rule coded in Matlab. Code is documented and easy to use. The design fatigue strength curve (S-N or stress-life curve) is specified using the standardized parameters from Eurocode 3 EN 1993-1-9. The cycle counts are done using a rainflow counting algorithm based on ASTM E1049-85.
Usage Examples
% reset workspace
clear all; close all; clc;

% generate a random stress-time history
% (250 random numbers between 100 and 600)
history = 100 + (600 - 100)*rand(250, 1);

% basic example (uses default values)
% the first input is the stress-time history
% the second input is the detail category (see EN 1993-1-9)
damage = fatdamage(history, 160)

% specify the number of times the stress-time history sample is repeated
damage = fatdamage(history, 160, 'Repetitions', 7500)

% specify a custom direct stress S-N curve
damage = fatdamage(history, 160, 'FirstSlope', 4, 'SecondSlope', 8)

% specify a custom shear stress S-N curve
damage = fatdamage(history, 112, 'StressType', 'shear', 'ShearSlope', 6)

% specify safety factors
damage = fatdamage(history, 160, 'ConstantAmplitudeFactor', 1.25, 'FatigueStrengthFactor', 1.35)

% specify number of bins in the rainflow histogram and number of colors in the colormap
damage = fatdamage(history, 160, 'Bins', [10, 20], 'Colors', 8)

% if no plot is required
damage = fatdamage(history, 160, 'Plot', false)
Example Output
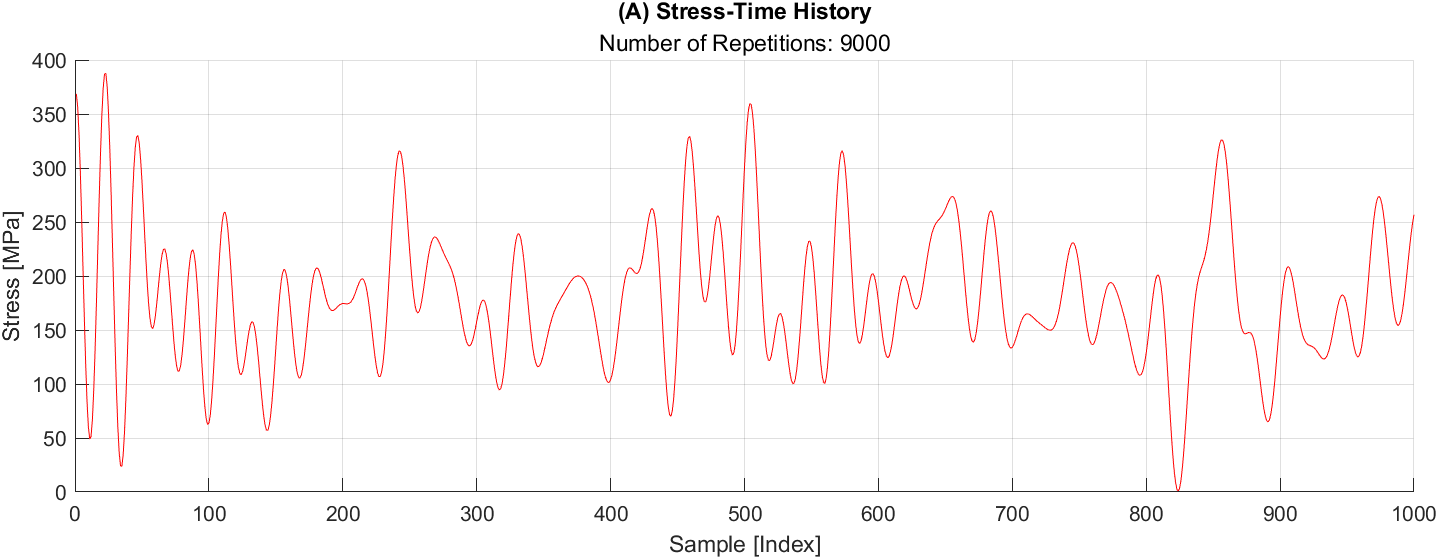
After execution, the following plots are shown, summarizing the fatigue analysis
A plot of the provided stress-time history:
A plot of the load reversals (local extrema, i.e., peaks and valleys):

The 2D rainflow histogram, where one can see the cycle counts joined in "buckets" of similar stress ranges and mean stresses:

The generated fatigue strength curve:

The linearly accumulated fatigue damage, failure is expected to occur if damage equals (or is greater than) 1. If damage is less than 1, the bar is shown in green, otherwise it is shown in red:

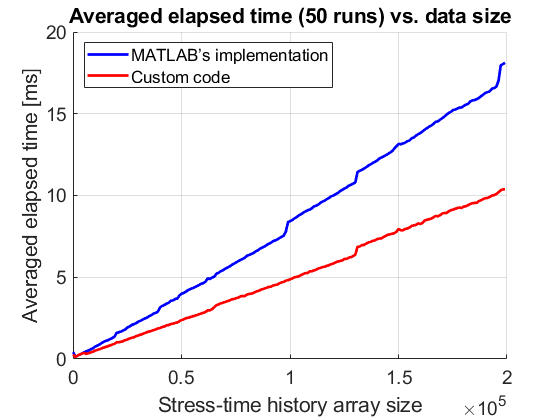
The Rainflow Counting Algorithm
The rainflow counting algorithm was implemented based on ASTM E1049-85 and its implementation was tested and validated by comparing its results with the ones obtained from Matlab’s rainflow function (from Signal Processing Toolbox). This implementation shows the same results while surpassing the efficiency of the Matlab’s solution.
Cita come
Carlos Souto (2026). Fatigue Damage Accumulation (https://github.com/carlos-souto/Fatigue-Damage-Accumulation), GitHub. Recuperato .
Souto, Carlos D. S., et al. “Fatigue Damage Tool (FDT) - A Tool for Fatigue Damage Assessment According to Design Codes.” Procedia Structural Integrity, vol. 22, Elsevier BV, 2019, pp. 376–85, doi:10.1016/j.prostr.2020.01.047.
Informazioni generali

Compatibilità della release di MATLAB
- Compatibile con qualsiasi release
Compatibilità della piattaforma
- Windows
- macOS
- Linux
Le versioni che utilizzano il ramo predefinito di GitHub non possono essere scaricate
| Versione | Pubblicato | Note della release | Action |
|---|---|---|---|
| 1.0.1 | Description update. |
||
| 1.0.0 |