
RDSAC and MKSAC: read and write SAC seismic data file
Imports/plots and exports seismic data file in the IRIS/SAC format.
Matlab codes to read and write SAC seismic data file
- 5,2K (senza limiti)
- 15 (ultimi 30 giorni)
- 4,9 / 5
- Community
-
15 lug 2022

SDOF subjected to a seismic input
This is the study of a SDOF subjected to a seismic input
- 831 (senza limiti)
- 3 (ultimi 30 giorni)
- 4,8 / 5
- Community
-
13 ott 2021

Radiation pattern from shear-tensile seismic source
Calculates P, S, SV and SH radiation pattern using shear-tensile seismic source model.
and azimuth.[1] Kwiatek, G. and Y. Ben-Zion (2013). Assessment of P and S wave energy radiated from very small shear-tensile seismic events in a deep South African mine. J. Geophys. Res. 118, 3630-3641
- 1,3K (senza limiti)
- 2 (ultimi 30 giorni)
- 5,0 / 5
- Community
-
17 set 2013

ANSeismic – Seismic Analysis of Structures with ANSYS and SAP2000
The seismic analysis in ANSYS may be implemented with ANSeismic
acceleration–time history data are used for seismic analysis. Such time histories may be derived synthetically, by either numerical simulation of the source and wave propagation mechanisms, or by considering proper
- 4,7K (senza limiti)
- 3 (ultimi 30 giorni)
- 5,0 / 5
- Community
-
16 nov 2015

Large Data in MATLAB: A Seismic Data Processing Case Study
These are the files used in the webinar on Feb. 23, 2011.
You can watch the archived version of this webinar at http://www.mathworks.com/videos/large-data-in-matlab-a-seismic-data-processing-case-study-81792.html (recommended). The demos show how to manage
- 19,4K (senza limiti)
- 6 (ultimi 30 giorni)
- 4,6 / 5
- Community
-
1 set 2016
Release 6.1925 of a collection of functions for analysis/display of seismic and well-log data.
- 9,5K (senza limiti)
- 5 (ultimi 30 giorni)
- 4,9 / 5
- Community
-
8 lug 2009

geoscience-community-codes/GISMO
GISMO - a framework for scientific research in seismology/infrasound
Project website: https://geoscience-community-codes.github.io/GISMOGISMO is designed to allow easy retrieval of seismic waveform data, event catalogs and station metadata from a variety of data
- 6,6K (senza limiti)
- 15 (ultimi 30 giorni)
- 5,0 / 5
- Community
-
13 apr 2023

FDTD simulation for Seismic Metamaterials (Crystals)
Finite-Difference Time-Domain (FDTD) simulation for Seismic Metamaterials (Crystals) Design for Earthquake Shield Applications
Finite-Difference Time-Domain (FDTD) simulation for 2D Seismic Metamaterials (Crystals) Design for Seismic Wave Isolation Researchs.For more details for Seismic Crystal(Metamaterials
- 2K (senza limiti)
- 1 (ultimi 30 giorni)
- 4,0 / 5
- Community
-
16 ott 2023

This script aims to offer the Shock Response Spectrum of an earthquake's acceleration time history
Irvine in 2006 as one of the eligible calculation methods.- For further information, please relate to the document "SeismicResponseSpectrumGUI.pdf" included in the .zip file.
- 1,6K (senza limiti)
- 3 (ultimi 30 giorni)
- 4,2 / 5
- Community
-
9 mar 2016
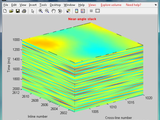
Release 10.0301 of a collection of functions for analysis/display of seismic and well-log data.
- 23,6K (senza limiti)
- 10 (ultimi 30 giorni)
- 4,4 / 5
- Community
-
1 mar 2010

GAOT-ECM Seismic Vibration Case Study
GAOT-ECM: Extension For Control And Modeling - Seismic Vibration Case Study with MR Damper
industrial plant identification and PID controller design.This file contains the Seismic Vibration Case Study. For other examples, please consult the GAOT-ECM: Extension For Control And Modeling main file.This
- 1,2K (senza limiti)
- 1 (ultimi 30 giorni)
- 4,8 / 5
- Community
-
22 mar 2016
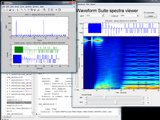
The Waveform Suite is now developed as part of the geoscience community codes, linked below.
MATLAB Toolbox for Seismic Data Analysis
- 11K (senza limiti)
- 5 (ultimi 30 giorni)
- 4,0 / 5
- Community
-
13 apr 2023

select the seismic phase from your interesting point
This code will help filter the depth, magnitude, and distance range of seismic waves that you desire. You can filter the phases you want from this code, and it will tell you how many events will
- 27 (senza limiti)
- 1 (ultimi 30 giorni)
- -- / 5
- Community
-
3 lug 2023
Calculates seismic parameters from an acceleration time series
This function calculates seismic parameters from an acceleration time series. Specifically, it calculates velocity vs time, displacement vs time, peak ground acceleration (PGA), peak ground velocity
- 1,1K (senza limiti)
- 2 (ultimi 30 giorni)
- 5,0 / 5
- Community
-
27 nov 2015

Simulation of particle motion during the propagation of seismic waves
Simulation of particle motion during the propagation of seismic wavesv1.0.2Odysseus Galanisogalanis.webpages.auth.grUpdated for Matlab R2025a in 2026*Originally written in 2007 to produce images for
- 7 (senza limiti)
- 7 (ultimi 30 giorni)
- -- / 5
- Community
-
2 lug 2026

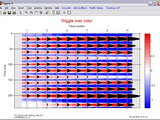
cqwva( d,y,x,index_incre,lvl,clip,line_color,face_color,mode , trace_balance )
The fastest wiggle variable area seismic data plotting function after comparison.
Matlab tools for geophysical (mainly exploration seismic) interpretation and processing
- 538 (senza limiti)
- 2 (ultimi 30 giorni)
- 5,0 / 5
- Community
-
4 mar 2017

SHAppE: Seismic HAzard Parameters Evaluation Interface
SHAppE facilitates probabilistic assessment of time dependent seismic hazard parameters.
# SHAppE: Seismic HAzard Parameters Evaluation App[
DynamicLinear-Seismic-Analysis-2DFrames
Functions and subroutines for the Dynamic Linear Seismic Analysis (Time-History) of 2D Frames
DynamicLinear-Seismic-Analysis-2DFramesFunctions and subroutines for the Dynamic Linear Seismic Analysis (Time-History) of 2D Frames
- 64 (senza limiti)
- 1 (ultimi 30 giorni)
- -- / 5
- Community
-
10 giu 2023
SGE-2 seismic data file importer
A Matlab function to import seismic traces as data blocks from an SGE-2 file.
Just executeData = importSGE2(filename)where filename is a string containing the path and name of the SGE-2 file.Seismic traces and their metadata are output as elements of lists. For example
- 16 (senza limiti)
- 2 (ultimi 30 giorni)
- -- / 5
- Community
-
18 mar 2025

Static-Seismic-Modal-Analysis-2DFrames
Subroutines and functions for the Static Seismic Modal Analysis of 2D Frames
Static-Seismic-Modal-Analysis-2DFramesSubroutines and functions for the Static Seismic Modal Analysis of 2D Frames
- 48 (senza limiti)
- 2 (ultimi 30 giorni)
- -- / 5
- Community
-
9 giu 2023

Given the Seismic input in t vs. a form, plots the displacement response spectra
In the context of seismic analysis of structures, various earthquake inputs may be required depending upon the nature of analysis being carried out. The response spectrum of an earthquake is the most
- 5,2K (senza limiti)
- 3 (ultimi 30 giorni)
- 4,8 / 5
- Community
-
16 set 2011
Multi-scale Multi-label Seismic-sample Collection
Multi-scale 3D well-seismic label classification extraction and high-dimensional feature analysis
- 46 (senza limiti)
- 3 (ultimi 30 giorni)
- -- / 5
- Community
-
10 feb 2022
Release 15.09.21 of a collection of functions for analysis/display of seismic and well-log data.
A set of about 170 functions (plus support functions called by them) for analysis and display of exploration-seismic data and well logs. These functions read and write seismic data in standard SEG-Y
- 7,7K (senza limiti)
- 24 (ultimi 30 giorni)
- 4,9 / 5
- Community
-
21 set 2015

P-PHASE ARRIVAL TIME PICKER BASED ON AKAIKE INFORMATION CRITERION
Computes P-phase arrival time in windowed digital single-component seismic recording using AIC
- 565 (senza limiti)
- 1 (ultimi 30 giorni)
- 5,0 / 5
- Community
-
30 set 2016

Simulates a seismic survey over a rectangular grid of area x by y meters
Seismic surveying requires placing a large number of sensors (geophones) in a large grid pattern, triggering a seismic event, and recording accelerometer readings at each sensor. These readings are
- 163 (senza limiti)
- 1 (ultimi 30 giorni)
- -- / 5
- Community
-
7 set 2016
Elastic and Inelastic Seismic Response Spectra
Calculation of elastic and inelastic spectra, given the gound acceleration, damping and ductility.
- 132 (senza limiti)
- 3 (ultimi 30 giorni)
- -- / 5
- Community
-
25 lug 2022
Minimal Path Sets Seismic Reliability Evaluation of Lifeline Networks with Link and Node Failures
Minimal Path Sets Seismic Reliability Evaluation of Lifeline Networks with Link and Node Failures
- 137 (senza limiti)
- 1 (ultimi 30 giorni)
- -- / 5
- Community
-
16 ott 2017

Script to calculate the seismic dispersion curve commonly used in MASW with curve picking options
- 1,8K (senza limiti)
- 5 (ultimi 30 giorni)
- 4,9 / 5
- Community
-
10 apr 2018

First Break Picking Data Seismik Refraksi
Komputasi Geofisika, Universitas Pertamina
: https://github.com/Metkom/OSGPUP/edit/master/seismic%20processing/seismic_first_break.mCite: Yasir, Moh.; Haq, M. Syauqil; Lase, Fanzly Togap Zisochi; Sena, Ariestian; Ilmi, M. Wildi Nurul; Sestha, Andrata Ganesha (2018): First Break Picking Data Seismik Refraksi. figshare
- 237 (senza limiti)
- 1 (ultimi 30 giorni)
- -- / 5
- Community
-
5 mar 2018

Bandpass Filter untuk Data Seismik
Komputasi Geofisika, Universitas Pertamina
: https://github.com/Metkom/OSGPUP/edit/master/seismic%20processing/seismic_bandpass_filter.mCite: Hidayat, Lutfi Nur; Syafrudin, Taufan Rifqi; Suwesti, Angreani; Khakim, Umar Abdul; Astuti, Mega Dwi; Hanafi, Mochammad Ibnu (2018): Bandpass Filter pada Data Seismik. figshare
- 200 (senza limiti)
- 1 (ultimi 30 giorni)
- -- / 5
- Community
-
4 mar 2018

Spektrum Data Seismik Sebagai Fungsi Kedalaman
Komputasi Geofisika, Universitas Pertamina
: https://github.com/Metkom/OSGPUP/edit/master/seismic%20processing/seismic_data_spektrum.mCite: Aisy, Safira Rihhadatul; Elsalama, Nadiah Faridah Firdausi; Anugrah, Sari Atika; Nabila, Afviya; Nugraha, Rama Desta (2018): Spektrum Data Seismik sebagai Fungsi Kedalaman. figshare
- 143 (senza limiti)
- 1 (ultimi 30 giorni)
- -- / 5
- Community
-
4 mar 2018

WIGGLE displays a matrix as lines plus filled lobes, useful for oscillatory and/or seismic data.
provide a visual analysis of seismic and seismological data, or any other vibration data, in order to help the identification of events that can be stressed out with the coherent alignment of lobes
- 2,9K (senza limiti)
- 3 (ultimi 30 giorni)
- 4,9 / 5
- Community
-
16 nov 2012

Dynamic response of a building subject to a seismic input
Dynamic response of a building subject to a seismic input
The script analizes the dynamic response of a linear system subject to a seismic input through the Response History Analysis (RHA) and the Response Spectrum Analysis (RSA).After the calculations
- 887 (senza limiti)
- 1 (ultimi 30 giorni)
- 5,0 / 5
- Community
-
13 ott 2021

Compute wavelet scale spectra from segmented discrete wavelet transform (Screenshot).
- 4,8K (senza limiti)
- 5 (ultimi 30 giorni)
- 4,0 / 5
- Community
-
27 nov 2012
Seismic Reservoir Modeling package
Seismic Reservoir Modeling MATLAB packageThe SeReM package includes five folders:Data: this folder contains six datasets used for the examples and the elevation dataset from Yellowstone National
- 350 (senza limiti)
- 3 (ultimi 30 giorni)
- -- / 5
- Community
-
13 gen 2022

This function generates elastic response spectrum for seismic design of buildings and bridges.
- 5,4K (senza limiti)
- 1 (ultimi 30 giorni)
- 4,4 / 5
- Community
-
1 giu 2019
This is utility to read SAC (Seismic Analysis Code) binary files created on/for SUN platform.
- 2,7K (senza limiti)
- 2 (ultimi 30 giorni)
- 4,5 / 5
- Community
-
18 ago 2003

Seis_Pick provides an interactive picking environment for processing seismic data.
Seis_pick provides an interactive environment for picking seismic waveforms. It has been developed with the principal purpose of processing downhole microseismic data, although is suitable for all
- 2,8K (senza limiti)
- 2 (ultimi 30 giorni)
- 3,8 / 5
- Community
-
17 feb 2012
Classic Deterministic Seismic Hazard Assessment
The calculation of the seismic hazard was based on assuming here the occurrence of a large earthquake of a certain magnitude at a specific location that affects the site where the motion assessment
- 9 (senza limiti)
- 1 (ultimi 30 giorni)
- -- / 5
- Community
-
12 gen 2026
SQUIGGLE stacked-line plot, typically used for plotting seismic and radar profiler data.
SQUIGGLE stacked-line plot, typically used for plotting seismic and radar profiler data.SQUIGGLE(Z) is a squiggle plot of each column in the matrix Z. Each value in Z is scaled to the maximum
- 2,3K (senza limiti)
- 1 (ultimi 30 giorni)
- 4,0 / 5
- Community
-
15 set 2004
Normalized spectrogram of a seismic acceleration
Normalized spectrogramNormalized spectrogram of a seismic accelerationNormalized spectrogram to seismic acceleration written in Matlab. The algorithm used is the following:1. Baseline
- 92 (senza limiti)
- 2 (ultimi 30 giorni)
- -- / 5
- Community
-
14 ago 2023

Computation of co-seismic displacements due to a rectangular dislocation in an elastic half-space.
Computation of static co-seismic displacements due to a dislocation-type deformation in a half-spaceDescription: This exact solution is often used to construct co-seismic displacements due to an
- 1,3K (senza limiti)
- 6 (ultimi 30 giorni)
- 4,0 / 5
- Community
-
14 gen 2013
Deep Neural Networks, Stacked Auto Encoder, and Deep Auto Encoder with Extreme Learning Machine
Please citeNuha, Hilal H., Adil Balghonaim, Bo Liu, Mohamed Mohandes, Mohamed Deriche, and Faramarz Fekri. "Deep Neural Networks with Extreme Learning Machine for Seismic Data Compression." Arabian
- 321 (senza limiti)
- 1 (ultimi 30 giorni)
- -- / 5
- Community
-
27 mar 2020
VPSHA: Vector-valued probabilistic seismic hazard analysis for circular seismic sources
This MATLAB function conducts a vector-valued probabilistic seismic hazard analysis (VPSHA) by making use of the truncated Gutenberg-Richter recurrence model. It considers only a uniform circular
- 5,0 / 5
- Community
-
16 lug 2020

Dynamic-NonLinear-SeismicAnalysis-3DFrames
Functions and subroutines for the Non-Linear Seismic Analysis of 3D Frames with the Newmark-Beta method
Dynamic-NonLinear-SeismicAnalysis-3DFramesFunctions and subroutines for the Non-Linear Seismic Analysis of 3D Frames with the Newmark-Beta method
- 87 (senza limiti)
- 1 (ultimi 30 giorni)
- -- / 5
- Community
-
14 giu 2023

Dynamic-Time-History-Seismic-Anlaysis-3DFrames
Functions and routines for the dynamic inelar seismic analysis of 3D (Time-History)
Dynamic-Time-History-Seismic-Anlaysis-3DFramesFunctions and routines for the dynamic inelar seismic analysis of 3D (Time-History)
- 69 (senza limiti)
- 1 (ultimi 30 giorni)
- -- / 5
- Community
-
12 giu 2023
Multidimensional Synchrosqueezed Transforms
superposition.3D synchrosqueezed wave packet transform. Applications:Geophysics: seismic wave field separation and ground-roll removal.Materials science: atomic crystal image analysis, grain boundary and local
- 919 (senza limiti)
- 3 (ultimi 30 giorni)
- 3,7 / 5
- Community
-
19 nov 2015

Three-Storey Building Response GUI
GUI for calculating the seismic response of a three storey-building.
This script aims to provide the seismic response of a three-storey building when subjected to either a force applied at a user-specified location or to the strike of a ground acceleration. The floors
- 433 (senza limiti)
- 1 (ultimi 30 giorni)
- -- / 5
- Community
-
17 mag 2016

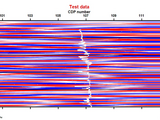
cqi_plotmatrix( data,varargin )
This function is used to plot seismic data in wiggles/wiggle-area
The function plot input data (2D matrix, each column represents a seismic trace) in wiggle/wiggle-area. You need to provide a 2D matrix with traces in columns as the first argument. Then you are able
- 795 (senza limiti)
- 2 (ultimi 30 giorni)
- -- / 5
- Community
-
9 gen 2016

M-band 2D dual-tree (Hilbert) wavelet multicomponent image denoising
Denoise multicomponent/color images with directional M-band dual-tree (Hilbert) wavelets
- 592 (senza limiti)
- 1 (ultimi 30 giorni)
- 5,0 / 5
- Community
-
30 apr 2016

Probabilistic Generator of Artificial Accelerogram Suites
Probabilistic generation of hazard-consistent suites of fully non-stationary seismic records
# Probabilistic generation of hazard-consistent suites of fully non-stationary seismic records.Tool for generating target spectrum-compatible fully-nonstationary artificial seismic ground motions The
- 21 (senza limiti)
- 2 (ultimi 30 giorni)
- -- / 5
- Community
-
9 nov 2024
Simple GUI application aimed at surface-consistent seismic static and amplitude correction. Interactive velocity model builder
G_SeisSimple 2D-Seismic data processing GUI applicationFunctionalitySEGY read/write (reads to binary file of format single)visualize data with three keys sortingsurface-consistent first arrival (or
- 572 (senza limiti)
- 1 (ultimi 30 giorni)
- -- / 5
- Community
-
19 ott 2022

Drawings Earthquake Engineering Research 4.0.2
Process corrections, filters, Fourier Spectra and Response 1GL for seismic acceleration records files
Process corrections, filters, Fourier Spectra and Response 1GL for seismic acceleration records files
- 46 (senza limiti)
- 1 (ultimi 30 giorni)
- -- / 5
- Community
-
31 ott 2022
Function in matlab to calculate AI (Arias Intensity) parameter from a seismic accelerogram
Arias IntensityFunction in matlab to calculate AI (Arias Intensity) parameter from a seismic accelerogramUsageThe arias intensity function is defined by:ai = arias_intensity(t
- 189 (senza limiti)
- 3 (ultimi 30 giorni)
- -- / 5
- Community
-
20 mar 2022

Static-Seismic-Modal-Analysis-3DFrames
Functions and subroutines for the Static Seismic Modal analysis of 3D Frames
Static-Seismic-Modal-Analysis-3DFramesFunctions and subroutines for the Static Seismic Modal analysis of 3D Frames
- 94 (senza limiti)
- 1 (ultimi 30 giorni)
- -- / 5
- Community
-
14 ago 2023

Wavelet-based generation of artificial accelerograms
This code generates target spectrum-compatible fully-nonstationary artificial seismic ground motions using the Continuous Wavelet Transform
# Wavelet-based stochastic model for the generation of fully non-stationary seismic accelerogramsTool for generating target spectrum-compatible fully-nonstationary artificial seismic ground motions
- 52 (senza limiti)
- 1 (ultimi 30 giorni)
- -- / 5
- Community
-
1 feb 2025

- 204 (senza limiti)
- 5 (ultimi 30 giorni)
- -- / 5
- Community
-
26 feb 2024

Design Response Spectrum (Standard 2800, 4th)
This Matlab function was developed to generate "Design Response Spectrum" based on the Iranian seismic standard named "Standard 2800".
Description in English:This Matlab function was developed to generate "Design Response Spectrum" based on the 4th edition of the Iranian seismic standard of the buildings named "Standard 2800". This
- 148 (senza limiti)
- 2 (ultimi 30 giorni)
- -- / 5
- Community
-
13 lug 2020

Komputasi Geofisika, Universitas Pertamina
: https://github.com/Metkom/OSGPUP/blob/master/Forward%20modeling/seismic_wedge_model.mCite: Anugerah, Nisfu; Ginting, Gamaliel Rhema; Wicaksono, Gigih Aji; Salsabila, Alda; Subakti, Puguh Ari; Syahputra, Loris Alif (2018): Membuat Model Sintetik untuk Model Pembajian. figshare
- 211 (senza limiti)
- 1 (ultimi 30 giorni)
- 3,3 / 5
- Community
-
4 mar 2018
Seismic Analysis - Response Spectrum Analysis for MDOF System
Response Spectrum Analysis for MDOF System
The purpose of this study is to develop a seismic analysis of MDOF Structure based on Response Spectrum Method. This analysis tool is written in MATLAB software to determine structural responses or a
- 1,1K (senza limiti)
- 1 (ultimi 30 giorni)
- 3,3 / 5
- Community
-
8 dic 2016