Why does executing the Moving the Camera Through a Scene produce unwanted numerical values?
I believe you're using a version of MATLAB that is older than R2014b. Is that correct? This looks like a bug that was fixed ...
oltre 11 anni fa | 0
| accettato
3D scale bar for mesh/surf?
You could start with something like this: function scalebar(xc,yc,zc, w, label) x = [xc, xc-w, nan, xc, xc , nan, xc,...
oltre 11 anni fa | 0
plotting isosurfaces in 2013 and 2014 versions
Ah, I've been meaning to write up something about this for the graphics blog. Transparency and the depth sorting technique th...
oltre 11 anni fa | 1
| accettato
Create new isosurface from a isosurface
The simplest way is the following. Let's start with a really simple example: [x y z v] = flow; q = z./x.*y.^3; p =...
oltre 11 anni fa | 1
How can I use (and display) two different colormaps on the same figure?
It depends. Are you trying to put the pcolor in the same axes or in different axes. Starting in R2014b, MATLAB has a separate co...
oltre 11 anni fa | 43
| accettato
surf colors with cylinder output
You're creating a lot of cylinders which each have a constant radius? If so, then something like this should work: cla h...
oltre 11 anni fa | 1
| accettato
Is any change 'DisplayName' property in plot function?
When we were rebuilding all of the graphics objects as MATLAB Objects, we found they they had several different variations of co...
oltre 11 anni fa | 9
| accettato
3D animation in MATLAB
I've recently been writing about creating animations on <http://blogs.mathworks.com/graphics/ our graphics blog> . Perhaps some ...
oltre 11 anni fa | 2
Setting gca LinestyleOrder but not color order
It doesn't move to the next entry in the LineStyleOrder until it's completed a lap of the ColorOrder. Since you are creating 6 p...
oltre 11 anni fa | 3
| accettato
Pubblicato
How the Tiger got its Stripes
But I think that my favorite Turing paper is one he wrote after the war called The Chemical Basis of Morphogenesis. It...
oltre 11 anni fa

How can I arrange several plots in one figure in 3D space?
Consider the following example: [x,y,c] = peaks; g1 = hgtransform('Matrix',makehgtform('translate',[0 0 -0.5])) h1 = ...
oltre 11 anni fa | 1
| accettato
R2014b support for graphic handle error
Did you already try running the tools it referred to in that blog post? <http://www.mathworks.com/products/matlab/matlab-grap...
oltre 11 anni fa | 0
Pubblicato
Implicit Curves & Surfaces
Implicit Curves and SurfacesIn some earlier posts ( part1, part2) we explored how to draw parametric curves using MATLAB...
oltre 11 anni fa

What happend about my plotting style
What happens if you do the following? get(gca,'FontSize') get(get(gca,'Title'),'FontSize') get(get(gca,'Title'),'Font...
oltre 11 anni fa | 0
| accettato
How can I put the epsilon letter (like the symbol "3" but in the other direction) in xlabel of plot of MatLab R2014b? I try to put '\epsilon' and 'varepsilon' but it doesn't work. Thanks in advance!
Starting in R2014b, you can also use all of the <http://blogs.mathworks.com/loren/2014/10/03/matlab-r2014b-graphics-part-1-featu...
oltre 11 anni fa | 8
how to show only a part of a surface fit that falls within a certain polygon
The simplest is to set zData to nan for the points you want to discard. Consider this example: [x,y,z] = peaks; px = [0 ...
oltre 11 anni fa | 0
| accettato
Pubblicato
Area Scaling
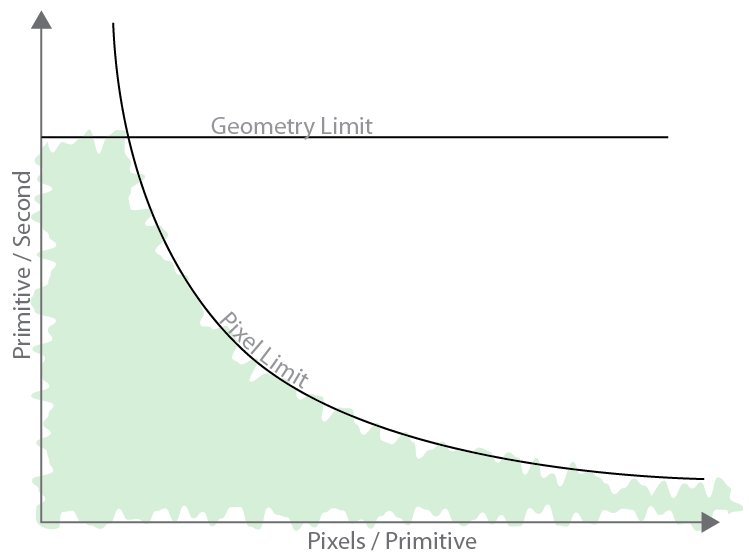
Last time we looked at how the performance of MATLAB's graphics system scales with the number of data points. Another...
oltre 11 anni fa
How to speed up surf plot for thousands of objects ?
Actually the number of points in the surface is probably not a major factor here. That's because the default 20x20 is small enou...
oltre 11 anni fa | 0
| accettato
Line marker specifiers duplicated - subplot legend
Are you sure you're not just seeing your plots behind the legend? Things are pretty crowded in that tiny axes. What happens if y...
oltre 11 anni fa | 2
| accettato
Pixelated text in figures using text() function
There are an awful lot of variables in play during font rasterization. I'd have to know a lot more about what you're doing. Here...
oltre 11 anni fa | 0
Setting Subplot Axes with Alpha Hull
The plot method for alphaShape sets the DataAspectRatio of the axes. You can get the same effect for your other axes by either a...
oltre 11 anni fa | 1
| accettato
Pubblicato
Performance Scaling
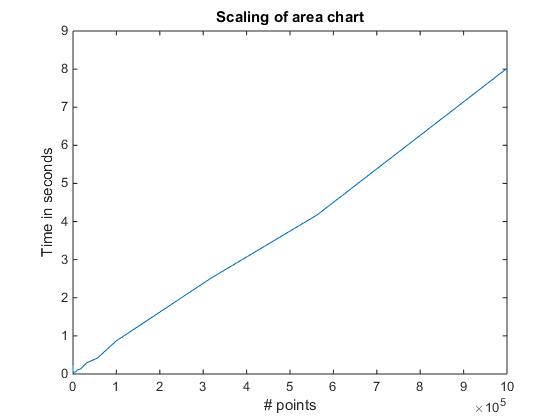
Performance ScalingGraphics performance is a complex and interesting field. It's one my group has been spending a lot of our...
oltre 11 anni fa
drawnow slower in 2014b ?
What's going on here is that in R2014b, the geometry is stored in the GPU's memory. Because you're modifying the XData & YData o...
quasi 12 anni fa | 3
| accettato
How can I set the Xtick / Ytick labels of my axes with the "Interpreter" as "none" in Matlab 8.4 (R 2014b) Version?
Or you can override the default interpreter: set(gca,'TickLabelInterpreter','none')
quasi 12 anni fa | 28
How to use Camera Views to simulate a real camera
You need to set the Projection to perspective. set(gca,'Projection','perspective') The default is orthographic, which is...
quasi 12 anni fa | 0
Pubblicato
Linked Selection
Linked SelectionWhen we create visualizations of data which have multiple values per data point, we need to use different...
quasi 12 anni fa

plotyy - how to change line width, colour and xaxis labels
Because each of your two plots contains two series, the variable hLine is an array of two line objects. Unfortunately, dot notat...
quasi 12 anni fa | 0
Why is zbuffer no longer available in 2014b? I need it. Thanks!
One of the problems we were trying to fix with the new graphics system was the fact that each of the renderers was missing a bun...
quasi 12 anni fa | 4
| accettato
R2014b tesselates contour plots when saving to eps
We've been discussing that change in <http://www.mathworks.com/matlabcentral/answers/162257-problem-with-patch-graphics-in-2014b...
quasi 12 anni fa | 0