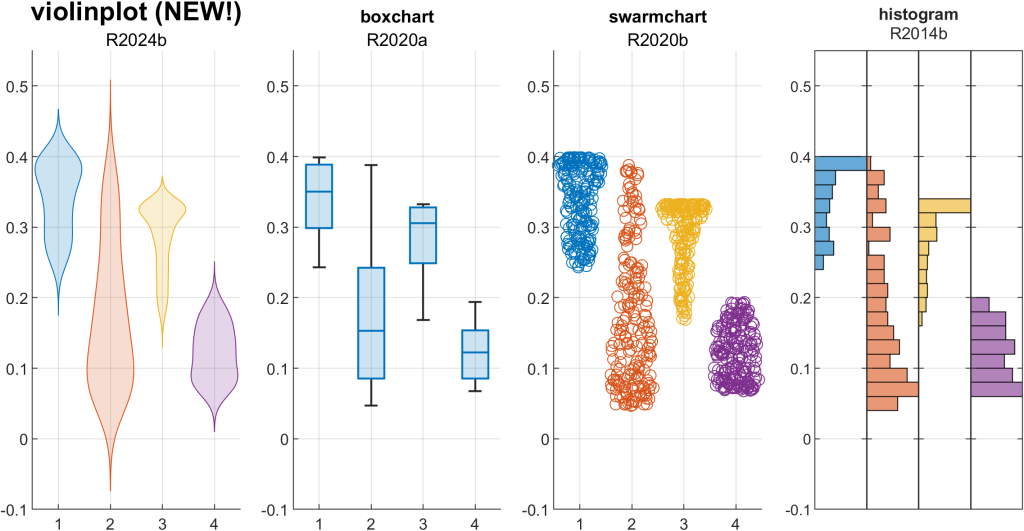
how to do violin plot in matlab
MATLAB now has a violinplot, introduced in R2024b. See also swarmchart tiledlayout(3,1) violinplot(nexttile,rand(20,3).*[.8 ...
oltre un anno fa | 0
How to create an external plot in live editor?
f = figure(); plot(magic(5)) f.Visible = 'on'; % This sets the external figure visibility to on alternatively, use uifigure...
oltre un anno fa | 0
Specify "plot box" position for tiled layout
> How can I set the postion of the "plot box" that is made up from the three tiled plots? The position property for axes in a T...
oltre un anno fa | 0
| accettato
multiple 3D plane plotting
Starting in R2024b, you can use the constantplane function to generate planes based on their vector normals. Using Matt J's demo...
oltre un anno fa | 1
how to draw a plane?
Starting in MATLAB R2024b, you can use constantplane to create a 2D plane in 3D axes. However, unlike surfaces and patches, the...
oltre un anno fa | 0
plotting a plane in three dimensions including data points
Starting in R2024b, use the constantplane function to plot a 2D plane in 3D axes. The ConstantPlane is defined by its normal v...
oltre un anno fa | 0
What figure properties does graymon sets?
In case anyone is still looking to flip between gray and colored figured, exportgraphics has a colorspace property that can be s...
quasi 2 anni fa | 0
I want to change the background value of figure to white.
Set the figure's color using the figure's Color property. set(gcf,'Color','white') Or set the color upon creation of the figur...
quasi 2 anni fa | 1
| accettato
Pubblicato
Plotting a New Course: A Grown-Up compassplot
Guest Writer: Abby Skofield Today's R2024b feature highlight is written by Abby Skofield, a developer on the Charting...
quasi 2 anni fa

How to add a 2D plot to an existing 3D plot by sharing the same axes?
This is challenging. The reason it's challenging is because camera properties are set relative to a point in an axes, not relat...
quasi 2 anni fa | 3
| accettato
Pubblicato
R2024b release: What’s new in Graphics and App Building?
Two of my favorite times of the year are September and March, when the landscape transforms beautifully in my area of the...
quasi 2 anni fa
first time use Histogram, need help
In MATLAB, I recommend using the histogram function. histogram('Categories',Categories,'BinCounts',counts) x = reshape([0.29:0...
quasi 2 anni fa | 1
Add title to one row of a subplot
Instead of using subplot, I recommend using tiledlayout which supports nested layouts and global titles. Follow these instructi...
quasi 2 anni fa | 0
dock graphics window size
To set an existing figure's position back to the factory default, set(fig,'Position','factory') Note that set() must be used ...
quasi 2 anni fa | 0
Why is my Mixed ANOVA including the intercept as an interaction term?
You can remove the interaction term by including "-1" in the model spec (doc). I also included terms for Congruency and Target i...
quasi 2 anni fa | 1
Variables window doesn't work after undocking in R2023b
Hi Kim, please contact tech support and include your instructions above how to reproduce the problem.
quasi 2 anni fa | 0
| accettato
exportgraphics causing strange messages in terminal only for Compiled version of App
This issue was fixed in R2024a. The problem occurred when setting append to true in exportgraphics.
quasi 2 anni fa | 2
| accettato
Fix to frequent "Application not responding" for MATLAB on the Mac
Thank you for sharing your experience, @Daniel Dolan and others. I've consulted with MathWorks developers who work on this infr...
quasi 2 anni fa | 1
Return cursor to commandline after plotting
I'm familiar with this issue. Please consider reporting your thoughts on the matter to Tech Support. The best way to do that is...
quasi 2 anni fa | 0
| accettato
When will the transition from Java to Javascript be complete?
Thanks for your questions and curiosity about the JavaScript transition. I highly recommend that you try out the beta version of...
quasi 2 anni fa | 4
| accettato
Vertical blank space in tiledlayout compact
> As you can see there is some vertical unnecessary space between the two horizontal stacks of plots. I would like to reduce it ...
quasi 2 anni fa | 1
How to get "Clean" edges on a surface plot?
Conversion from 3D scatter points to a surface is not straightforward. Here, I'm using Delaunay triangulation to create a mesh ...
quasi 2 anni fa | 0
| accettato
How to get "Clean" edges on a surface plot?
Use convhull to enclose the polyton and trisurf to plot the results. Code from OP GS = [0,0 0.225,2.35 1.325,5.525 ...
quasi 2 anni fa | 0
Plotting two surface plots in the same figure using two different colormaps
Assign two surface objects two different colormaps using Truecolor arrays The recommended approach is to create an overlayed ax...
quasi 2 anni fa | 2
changing font size in all the elements of figures
Starting in MATAB R2022a you can use the fontsize command. For example, to set the fontsize to 15 points for all* text in a fi...
quasi 2 anni fa | 1
How to change the size of heatmap axis labels
How to independently change fontsize of tick labels and axis labels in heatmap Heatmap's FontSize property sets the font size f...
quasi 2 anni fa | 0
Pubblicato
Creating a Flight Tracking Dashboard, Part 2: Developing an Aircraft Chart
Guest Writer: Ken Deeley Ken is an application engineer in Cambridge, UK, supporting MathWorks users with their technical...
quasi 2 anni fa

Invalid Parameter Name: EdgeColor
Thanks for sharing this. This is a bug that was fixed in MATLAB R2024a Update 5, released on 12 July 2024. hist3(X,[250 250],...
quasi 2 anni fa | 3
| accettato
Pubblicato
Animating Science: Creating Time-Sensitive Animations with MATLAB
Guest Writer: Gianluca Carnielli Gianluca is an application engineer at MathWorks based in Italy. While he supports MATLAB...
quasi 2 anni fa

How do you set the Layout Option at construction for ui objects?
See David's answer in the thread below for a one-liner solution: https://www.mathworks.com/matlabcentral/answers/1977184-can-yo...
circa 2 anni fa | 0
| accettato