visualize
Description
visualize( plots the octave spectrum
computed by the o)octaveSpectrumEstimator
System object™. The visualization is updated with the computed spectrum as the simulation
progresses.
Examples
Create a dsp.AudioFileReader to stream an audio file for processing. Create an audioDeviceWriter to play the audio as you stream it.
reader = dsp.AudioFileReader("FunkyDrums-44p1-stereo-25secs.mp3");
player = audioDeviceWriter(SampleRate=reader.SampleRate);Create an octaveSpectrumEstimator object with the same sample rate as the file reader.
o = octaveSpectrumEstimator(reader.SampleRate)
o =
octaveSpectrumEstimator with properties:
SampleRate: 44100
Bandwidth: '1/3 octave'
FrequencyWeighting: 'A-weighting'
TimeWeighting: 'fast'
FrequencyRange: [22 22050]
FilterOrder: 2
ReferenceFrequency: 1000
OctaveRatioBase: 10
ApplyLog: false
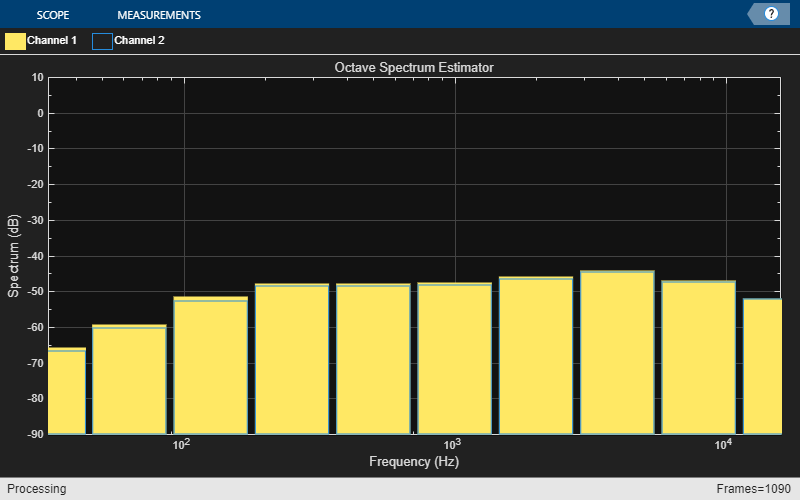
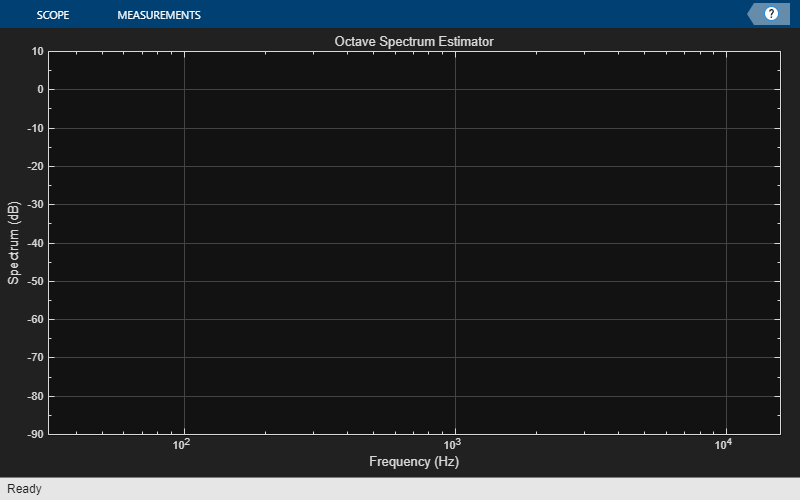
Call visualize on the object to open a visualizer to display the spectrum.
visualize(o)

In a streaming loop:
Read in a frame of audio data.
Compute the octave-band spectrum
Play the audio with the device writer.
See the visualizer update with the measured spectrum as the audio plays.
while ~isDone(reader) audioIn = reader(); p = o(audioIn); player(audioIn); end

Create a dsp.AudioFileReader to stream an audio file for processing. Create an audioDeviceWriter to play the audio as you stream it.
reader = dsp.AudioFileReader("FunkyDrums-44p1-stereo-25secs.mp3");
player = audioDeviceWriter(SampleRate=reader.SampleRate);Create an octaveSpectrumEstimator object with the same sample rate as the file reader and set the Bandwidth to 1 octave.
o = octaveSpectrumEstimator(reader.SampleRate,Bandwidth="1 octave");Call visualize on the object to open a visualizer to display the spectrum.
visualize(o)

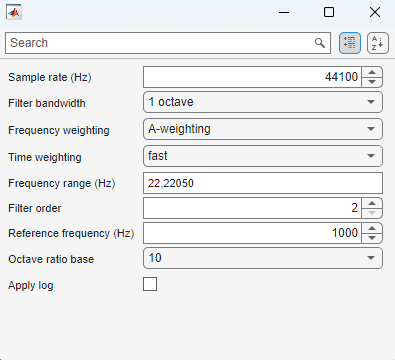
Call parameterTuner to open a UI to tune parameters of the octaveSpectrumEstimator while streaming.
parameterTuner(o)

In a streaming loop:
Read in a frame of audio data.
Compute the octave-band spectrum
Play the audio with the device writer.
Adjust the properties in the parameterTuner UI while streaming.
while ~isDone(reader) audioIn = reader(); p = o(audioIn); player(audioIn); end

Input Arguments
Octave spectrum estimator to visualize, specified as an octaveSpectrumEstimator
System object.
Output Arguments
Handle to the octave spectrum visualizer, returned as an
audio.ui.scope.OctaveSpectrumVisualizer object.
More About
Changing the Bandwidth, FrequencyRange, ReferenceFrequency, or OctaveRatioBase properties on the octaveSpectrumEstimator
object results in a change of the number of octave bands displayed in the visualizer. In
this case, the object resets the scope before continuing to display the spectrum.
Version History
Introduced in R2024b
See Also
MATLAB Command
You clicked a link that corresponds to this MATLAB command:
Run the command by entering it in the MATLAB Command Window. Web browsers do not support MATLAB commands.
Seleziona un sito web
Seleziona un sito web per visualizzare contenuto tradotto dove disponibile e vedere eventi e offerte locali. In base alla tua area geografica, ti consigliamo di selezionare: .
Puoi anche selezionare un sito web dal seguente elenco:
Come ottenere le migliori prestazioni del sito
Per ottenere le migliori prestazioni del sito, seleziona il sito cinese (in cinese o in inglese). I siti MathWorks per gli altri paesi non sono ottimizzati per essere visitati dalla tua area geografica.
Americhe
- América Latina (Español)
- Canada (English)
- United States (English)
Europa
- Belgium (English)
- Denmark (English)
- Deutschland (Deutsch)
- España (Español)
- Finland (English)
- France (Français)
- Ireland (English)
- Italia (Italiano)
- Luxembourg (English)
- Netherlands (English)
- Norway (English)
- Österreich (Deutsch)
- Portugal (English)
- Sweden (English)
- Switzerland
- United Kingdom (English)