visualize
Description
visualize( plots the magnitude
response of the shelving filter. The plot is updated automatically when you change the
object properties.shelvFilt)
hvsz = visualize(___)dsp.DynamicFilterVisualizer object when you call this syntax with any of the
previous input arguments.
Examples
Create a shelvingFilter object, and then call visualize to plot the magnitude response of the filter.
shelvFilt = shelvingFilter(2,1,400,"lowpass");
visualize(shelvFilt)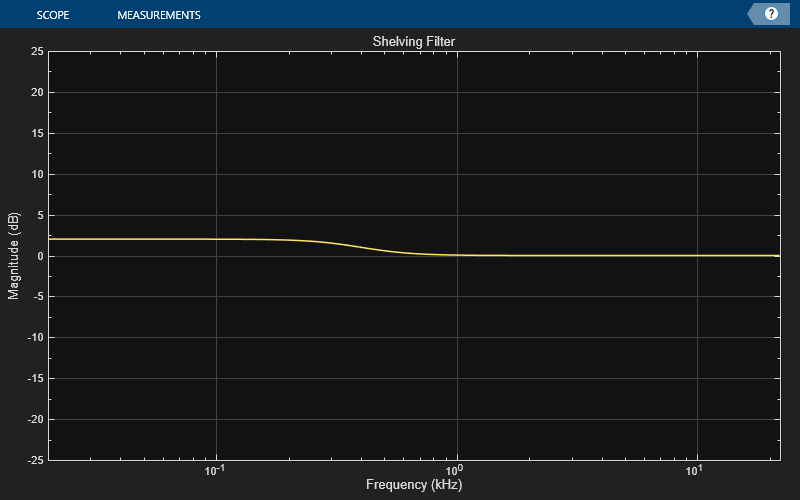
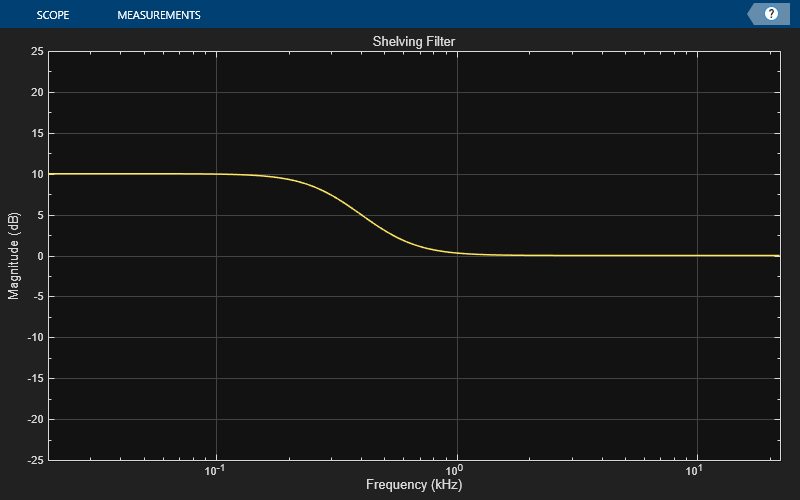
Modify the gain and observe that the plot is updated automatically.
shelvFilt.Gain = 10;
Input Arguments
Version History
Introduced in R2022a