msheatmap
Create pseudocolor image of set of mass spectra
Description
msheatmap(
displays a pseudocolor heatmap image of the intensities for the spectra in the
MZ,Intensities)Intensities matrix.
msheatmap(
displays a pseudocolor heatmap image of the intensities for the spectra in matrix
MZ,Times,Intensities)Intensities, using the retention times in the
Times vector to label the y-axis.
msheatmap(___,
specifies additional options using one or more name-value arguments.Name=Value)
Examples
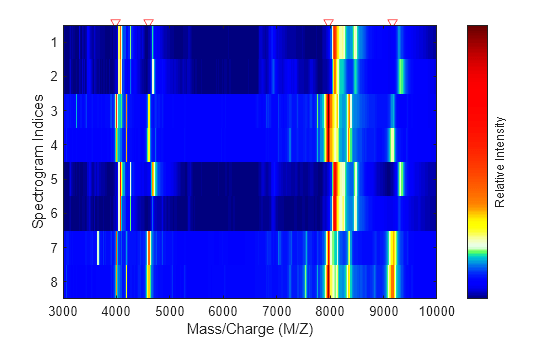
Load the SELDI-TOF sample data provided with the software.
load sample_lo_resCreate a vector of four m/z values to mark along the top horizontal axis of the heatmap.
M = [3991.4 4598 7964 9160];
Display the heat map with m/z markers and a limited m/z range.
msheatmap(MZ_lo_res,Y_lo_res,Markers=M,Range=[3000 10000]);
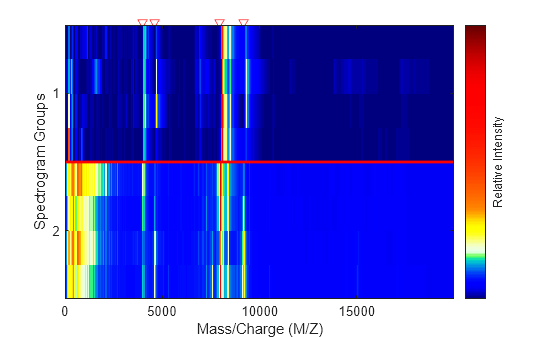
Display the heat map again grouping each spectrum into one of two groups.
TwoGroups = [1 1 2 2 1 1 2 2];
msheatmap(MZ_lo_res,Y_lo_res,Markers=M,Group=TwoGroups);
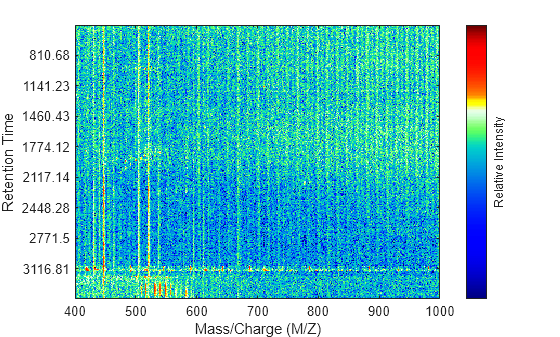
Load the LC/MS sample data provided with the software.
load lcmsdataResample the peak lists to create a vector of m/z values and a matrix of intensity values.
[MZ,Intensities] = msppresample(ms_peaks,5000);
Display the heat map showing mass spectra at different retention times.
msheatmap(MZ,ret_time,log(Intensities));
Input Arguments
Name-Value Arguments
Version History
Introduced before R2006a
See Also
mspalign | msbackadj | msdotplot | msalign | mslowess | msnorm | mspeaks | msresample | msppresample | mssgolay | msviewer
Topics
- Mass Spectrometry and Bioanalytics
- Preprocessing Raw Mass Spectrometry Data
- Visualizing and Preprocessing Hyphenated Mass Spectrometry Data Sets for Metabolite and Protein/Peptide Profiling
- Differential Analysis of Complex Protein and Metabolite Mixtures Using Liquid Chromatography/Mass Spectrometry (LC/MS)