Acquire Data in Background with Live Plot Updates
This example shows how to acquire data in the background using callbacks while MATLAB® continues to run.
A background acquisition uses callbacks to access data as the hardware collects it or
to handle errors as they occur. In contrast, foreground acquisition causes MATLAB to
wait for the entire acquisition to complete before you can execute your next command. In
this example, you acquire data in the background from a microphone with ID
Audio1, and you define a callback to update a plot in real time
while acquisition continues.
Device Discovery and Setup
Get a list of devices available on your machine and identify the microphone you want
to use. The partial listing here indicates the vendor ID and device ID used in this
example, a DirectSound headset microphone with device ID
Audio1.
daqlist
      VendorID       DeviceID                         Description
    _____________    ________    ____________________________________________________

    "directsound"    "Audio1"    "DirectSound Headset Microphone (Plantronics BT600)"
Create a directsound
DataAcquisition
object with a microphone input channel on Audio1.
mic = daq("directsound");
ch = addinput(mic,"Audio1",1,"audio");
Background Acquisition and Live Plot Setup
Configure a callback function using the ScansAvailableFcn property to update a live plot with the data from
background acquisition. This example uses the plotMyData callback
function defined in the next section.
The callback is triggered when the number of accumulated scans exceeds the value of
the ScansAvailableFcnCount property. By default, this value is set to
Rate/10, so the callback is triggered 10 times per second.
mic.ScansAvailableFcn = @plotMyData;
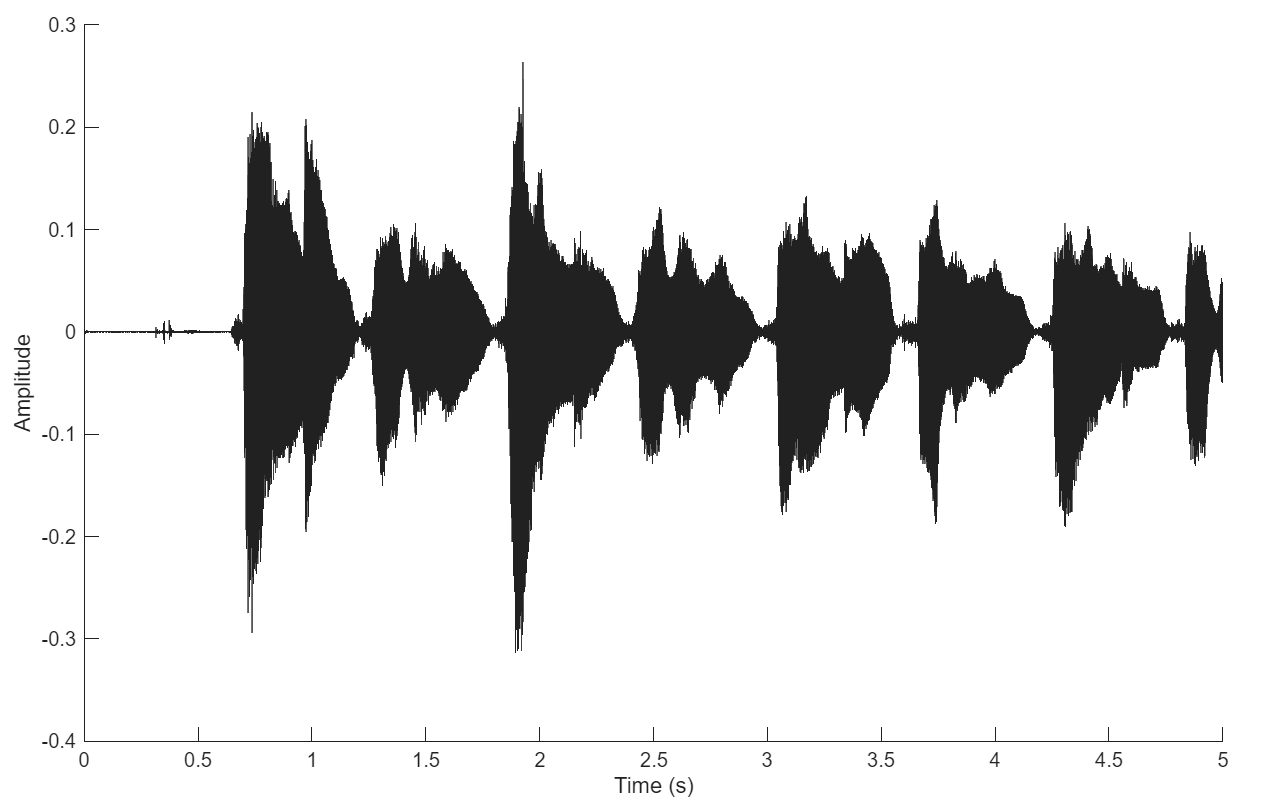
Start the acquisition to run for 5 seconds in the background.
start(mic,"Duration",seconds(5))To create a live-updating line plot, assign an animated line plot to the
UserData property of the data acquisition object,
mic. During background acquisition, the callback function adds
points to this plot dynamically.
figure;
xlabel("Time (s)");
ylabel("Amplitude");
mic.UserData = animatedline;
Callback Function
This callback function updates the live plot with the data acquired in the
background. The function takes two inputs, the callback source and event information.
MATLAB passes the DataAcquisition object that triggers the
callback as the first input, src. The second input contains event
information, which is not used in this example. The function reads data from
src and updates the live plot by adding the data to the animated
line stored in the UserData property.
function plotMyData(src,~)
     [data,timestamps,~] = read(src,src.ScansAvailableFcnCount,OutputFormat="Matrix");
      addpoints(src.UserData,timestamps,data);
 end
During the background acquisition, speak into the microphone and see the plot update in real time.