GRNN Function Approximation
This example uses functions NEWGRNN and SIM.
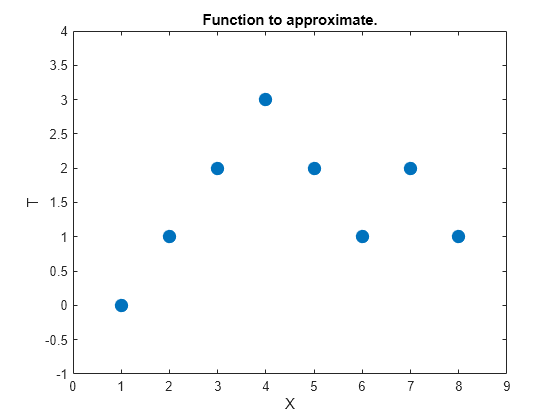
Here are eight data points of y function we would like to fit. The functions inputs X should result in target outputs T.
X = [1 2 3 4 5 6 7 8];
T = [0 1 2 3 2 1 2 1];

plot(X,T,'.','markersize',30)
axis([0 9 -1 4])
title('Function to approximate.')
xlabel('X')
ylabel('T')
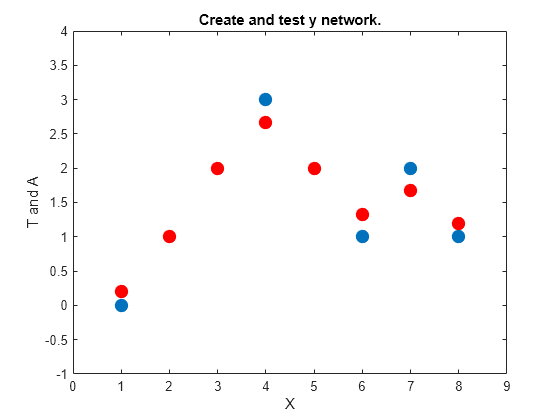
We use NEWGRNN to create y generalized regression network. We use y SPREAD slightly lower than 1, the distance between input values, in order, to get y function that fits individual data points fairly closely. A smaller spread would fit data better but be less smooth.
spread = 0.7;
net = newgrnn(X,T,spread);
A = net(X);

hold on
outputline = plot(X,A,'.','markersize',30,'color',[1 0 0]);
title('Create and test y network.')
xlabel('X')
ylabel('T and A')
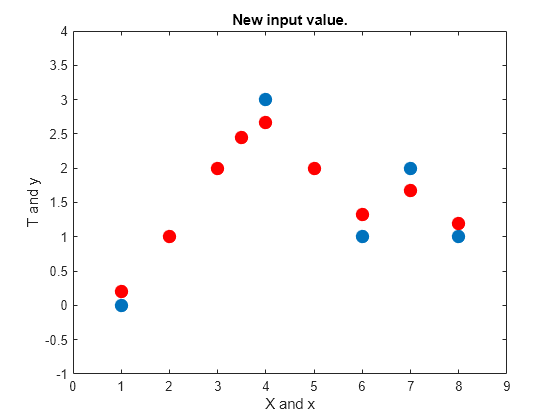
We can use the network to approximate the function at y new input value.
x = 3.5;
y = net(x);
plot(x,y,'.','markersize',30,'color',[1 0 0]);
title('New input value.')
xlabel('X and x')
ylabel('T and y')
Here the network's response is simulated for many values, allowing us to see the function it represents.
X2 = 0:.1:9;
Y2 = net(X2);
plot(X2,Y2,'linewidth',4,'color',[1 0 0])
title('Function to approximate.')
xlabel('X and X2')
ylabel('T and Y2')
