show
Description
Add-On Required: This feature requires the Scenario Builder for Automated Driving Toolbox add-on.
show(
specifies options using one or more name-value arguments. For example,
rsObj,Name=Value)ShowColorbar=true displays the road surface with a color bar.
figHandle = show(___)Figure object using any combination of input
arguments from previous syntaxes.
Examples
Load point cloud data and a road reference line into the workspace.
Note: The point cloud data must contain the road information for the specified road reference line.
data = load("roadSurfaceData.mat","ptCld","roadRefLine");
ptCld = data.ptCld;
roadRefLine = data.roadRefLine;
Specify the width of the road from the reference line as 4 meters on the left and 3 meters on the right.
roadWidthFromRefLine = [4 3];
Specify the resolution of the road surface as 1 cm each in the longitudinal and lateral directions.
gridResolution = [0.01 0.01];
Create a road surface object.
rsObj = roadSurface(ptCld,roadRefLine,roadWidthFromRefLine,gridResolution)
rsObj =
  roadSurface with properties:

         RoadReferenceLine: [6×2 double]
         LateralResolution: 0.0100
    LongitudinalResolution: 0.0100
      RoadWidthFromRefLine: [4 3]
       InterpolationMethod: "nearest"
       ExtrapolationMethod: "nearest"
               LocalOrigin: []
    HasNormalizedElevation: 1
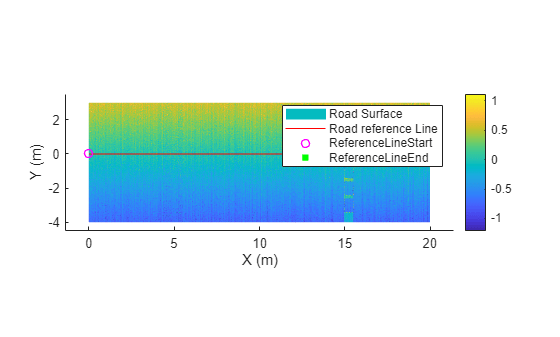
Visualize the road surface.
show(rsObj)
Input Arguments
Name-Value Arguments
Output Arguments
Tips
The show object function displays the normalized elevation or the raw
elevation of the road surface based on the value of the HasNormalizedElevation property of the input road surface object
rsObj. If HasNormalizedElevation is
true, the function displays the normalized elevation. If
HasNormalizedElevation is false, the function displays
the raw elevation.
Version History
Introduced in R2025b