Main Content

setoptions

Set options for idplot and spectrumplot

Description

setoptions(h,opts) sets options for the plot associated with plot handle h to the options specified in opts.

setoptions(h,Name=Value) specifies one or more plot options using name-value arguments. For example, setoptions(sp,FreqUnits='rad/s') sets the frequency units of spectrum plot sp to radians per second.

To see the supported options for a specific plot type, see the corresponding options page indicated in opts.

example

setoptions(h,opts,Name=Value) first sets options using the values in opts, and then overrides specific options using the one or more name-value arguments.

Examples

collapse all

Obtain the identified model.

load iddata9 z9
sys = ar(z9,4);

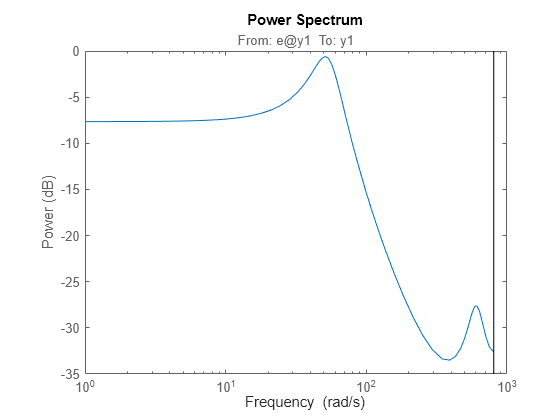
Get the plot handle for the model spectrum plot.

h = spectrumplot(sys);

Figure contains an axes object. The axes object with title From: e@y1 To: y1, ylabel Power (dB) contains an object of type line. This object represents sys.

(Optional) Specify the plot options, using the plot handle.

setoptions(h,'FreqUnits','Hz','FreqScale','linear','Xlim',{[0 20]},'MagUnits','abs');

Figure contains an axes object. The axes object with title From: e@y1 To: y1, ylabel Power (abs) contains an object of type line. This object represents sys.

Input Arguments

collapse all

Plot handle, specified as a handle object for one of the following plots.

Plot options, specified as one of the following plot option objects depending on the chart object specified in h.

To obtain the options form an existing chart object, use getoptions.

Version History

Introduced in R2012a

See Also