Display Multiple Images
This page describes options for displaying multiple 2-D images at the same time. For an overview of display capabilities in Image Processing Toolbox™, see Choose Approach to Display 2-D and 3-D Images.
Load Images
Read three images into the workspace.
pears = imread("pears.png");
peppers = imread("peppers.png");
moon = imread("moon.tif");
Display Images Individually
Display the images one at a time by using the imshow function. In the Live Editor, each imshow call displays an image as a separate output. In plain code scripts or the MATLAB® command window, each call to imshow replaces the image in the current figure. To instead display each image in its own figure, use the figure command to create a new figure window between calls to imshow.
imshow(pears)

figure
imshow(peppers)
You can customize how imshow displays an image by using name-value arguments. For example, this code displays the moon image using the turbo colormap at 50% magnification.
figure
imshow(moon,Colormap=turbo,InitialMagnification=50)

Display Pair of Images
Display two images as an overlay or montage by using the imshowpair function.
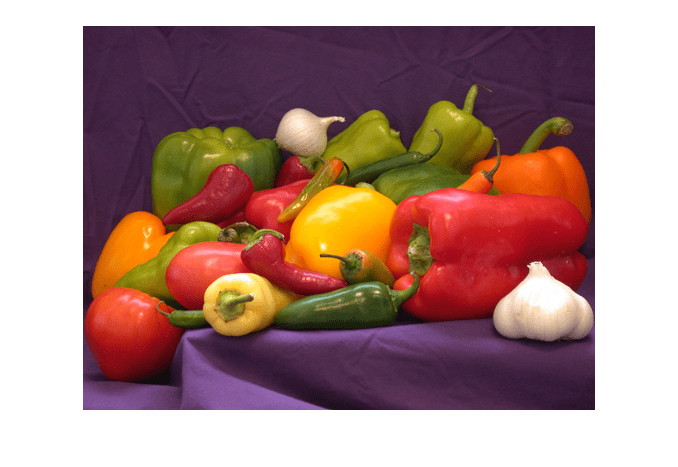
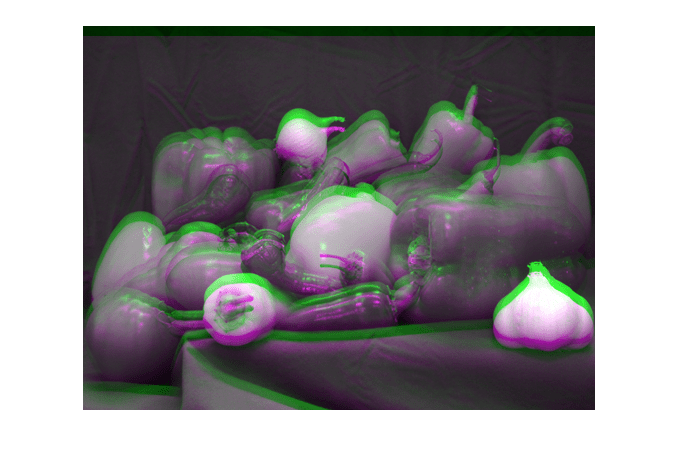
Translate a copy of the peppers image and compare it to the original image. By default, imshowpair converts the images to grayscale and displays them as a falsecolor overlay.
peppersTranslate = imtranslate(peppers,[0 10]);
imshowpair(peppers,peppersTranslate)
You can optionally specify the method used to display the images as a third input argument. For example, display the images using alpha blending.
imshowpair(peppers,peppersTranslate,"blend") 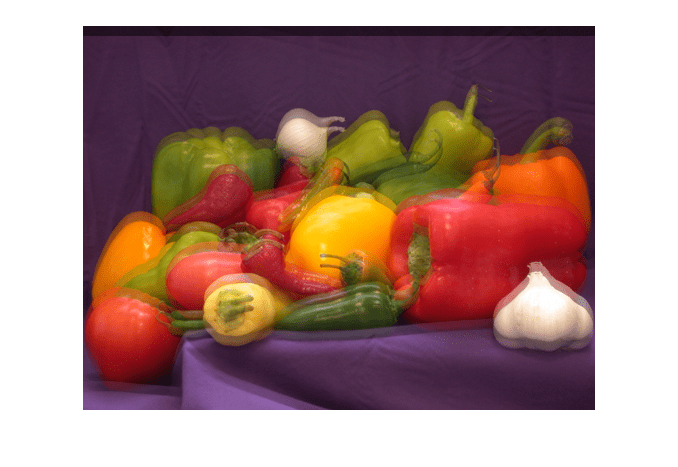
Other options include displaying images as a montage, a checkerboard pattern, or a difference image. This graphic shows how the images display for each option.
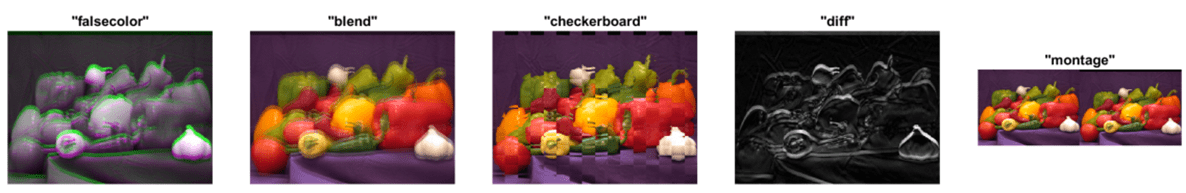
The output of the "montage" method is generally similar to the output of the montage function. However, while montage always jointly rescales the intensities of all images to the same display range, you can choose whether imshowpair scales the image display ranges independently, jointly, or applies no scaling by specifying the Scaling name-value argument. See the imshowpair and montage reference pages for details.
Display Multiple Images as a Montage
Display multiple images next to each other by using the montage function.
You can specify the images to display in various ways, such as using a multiframe array, a list of filenames, or an image datastore. You can also specify an image volume as input to display the volume slices as a montage. To display images that are different sizes, such as in this example, specify a cell array of matrices. By default, montage arranges the images in rows and columns to roughly form a square. The function scales each image to fit in the montage while preserving its original aspect ratio.
imagelist = {pears moon peppers peppersTranslate};
figure
montage(imagelist)
You can customize characteristics such as which images in a multiframe array to display, the space between images, and the background color between images using name-value arguments. For example, this code displays the images as one row with a white background.
figure
montage(imagelist,Size=[1 NaN],BackgroundColor="white")
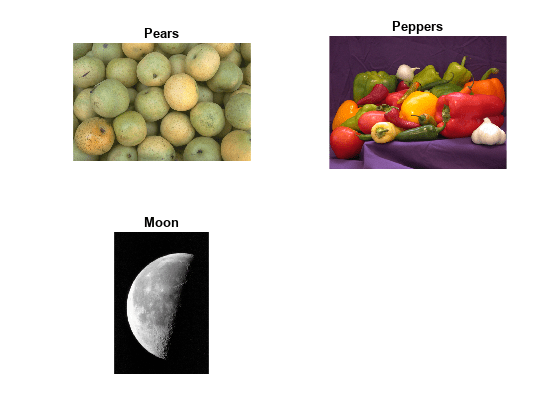
Display Images as a Tiled Layout
Display multiple images with different titles, colormaps, and colorbars by using the tiledlayout function.
To create a tiled layout, specify the number of rows and columns to include using the tiledlayout function. Next, call the nexttile function to place an axes object in the layout. Then, call imshow to display the image in the axes. You can optionally specify additional details for the tile, such as a title. When you are ready to move to the next tile, use the nexttile function.
figure
tiledlayout(2,2)

nexttile
imshow(pears)
title("Pears")

nexttile
imshow(peppers)
title("Peppers")

nexttile
imshow(moon)
title("Moon")
You can use tiledlayout to display a grayscale image using multiple colormaps within a single figure or one Live Editor output.
figure
tiledlayout(1,2);

nexttile
imshow(moon)
colorbar
title("Moon - Original")

nexttile
imshow(moon,turbo)
colorbar
title("Moon - Turbo")

You can also use tiledlayout with the linkaxes function to keep images synchronized as you zoom and pan. When using the nexttile function to move to a tile you want to link, include an output argument to return the axes object of that tile. Then, link the returned axes of tiles by specifying them to the linkaxes function.
moonfilt = imgaussfilt(moon,2);

figure
tiledlayout(1,2)

ax1 = nexttile;
imshow(moon)
title("Original")

ax2 = nexttile;
imshow(moonfilt)
title("Filtered")

linkaxes([ax1 ax2])
Zoom to the same subregion in both images. You can also zoom or pan interactively by using the axes toolbar in the figure window.
xlim([100 150])
ylim([120 180])

Display Label Images
You can display label images by using the labeloverlay function, for binary, numeric, and categorical label images, or the imoverlay function, for binary labels only. The labeloverlay and imoverlay functions create a fused image of the label image over the original image. You can display the fused image using any display function, such as imshow or imshowpair.
For example, create a numeric label image for the pears image using watershed segmentation.
pearscomp = imcomplement(im2gray(pears));
pearsfilt = imhmin(pearscomp,30);
pearslabel = watershed(pearsfilt);
Create a fused image of the labels overlaid on the original image.
pearsoverlay = labeloverlay(pears,pearslabel);
Display the fused image.
figure
imshow(pearsoverlay)

Create a binary mask of the moon using thresholding.
t = graythresh(moon);
BW = imbinarize(moon,t);
Create a fused image of the mask overlaid on the original image.
B = imoverlay(moon,BW);
Display the original moon image and fused overlay side-by-side.
figure
imshowpair(moon,B,"montage")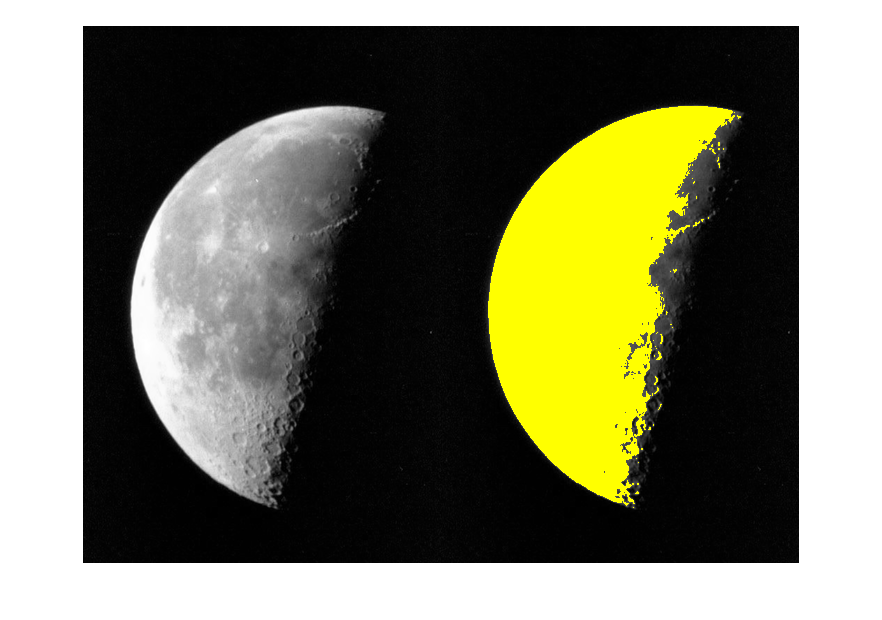
See Also
imshow | imshowpair | montage | tiledlayout | labeloverlay | imoverlay