Display an Image in Figure Window
Overview
The imshow function is suitable for basic display
of 2-D images. Starting in R2024b, you can also display 2-D images by using the imageshow function. While both functions are capable of displaying images in a
figure window, there are some key differences that make each suitable for different
applications.
The imshow has these benefits:
Displays images within an axes, which you can customize using MATLAB® graphics functions. For example, display multiple images together using
tiledlayout, or add annotations like a title, axes labels, and data tips.Displays images in a figure window with a default menu and toolbar that allows to you perform common actions like saving or printing images from the figure.
The imageshow function has these benefits:
Designed for improved rendering quality, fast performance, and smooth zoom and pan interactions, especially for medium and large images and in MATLAB Online™.
Can display image data stored as a numeric array or a blocked image, including file-backed images that are too large to fit in memory.
The displayed image fills the figure window as you zoom in, using a larger portion of the screen compared to
imshow.
Note
When you display images in the Live Editor, the figure is embedded in the live script
output. To open the figure in a separate window, click the Open in figure window button ![]() in the upper-right corner of the Live Editor
output.
in the upper-right corner of the Live Editor
output.
Display Image Using imshow
Read an image into the workspace and display it using the imshow function.
moon = imread("moon.tif");
imshow(moon)
You can also specify the image to display as a filename. Note, however, that this syntax
does not store the image data in the workspace. If you want to bring the image into the
workspace, you must use the getimage function, which retrieves the image
data from the current image object.
imshow("moon.tif");For more information about using imshow to display the various image
types supported by the toolbox, see Display Different Image Types.
Specifying the Initial Image Magnification
By default, imshow attempts to display an image in its
entirety at 100% magnification (one screen pixel for each image pixel). However, if an
image is too large to fit in a figure window on the screen at 100% magnification,
imshow scales the image to fit onto the screen and issues a warning
message.
To override the default initial magnification behavior for a particular call to
imshow, specify the InitialMagnification
parameter. For example, to view an image at 150% magnification, use this code.
pout = imread("pout.tif");
imshow(pout,InitialMagnification=150)
imshow attempts to honor the magnification you specify. However, if
the image does not fit on the screen at the specified magnification,
imshow scales the image to fit. You can also specify
"fit" as the initial magnification value. In this case,
imshow scales the image to fit the current size of the figure
window.
To change the default initial magnification behavior of imshow, set
the ImshowInitialMagnification toolbox preference. To set the
preference, open the Image Processing Toolbox™ Preferences dialog box by calling iptprefs or, on the MATLAB
Home tab, in the Environment section, click
![]() Preferences.
Preferences.
When imshow scales an image, it uses interpolation to determine the
values for screen pixels that do not directly correspond to elements in the image matrix.
By default, imshow uses nearest neighbor interpolation, but you can
specify to use bilinear interpolation by setting the Interpolation
name-value argument.
Controlling the Appearance of the Figure
By default, when imshow displays an image in a figure, it surrounds
the image with a gray border. You can change this default and suppress the border using
the "Border" name-value argument, as shown in the following
example.
imshow("moon.tif",Border="tight")
The following figure shows the same image displayed with and without a border.

The "Border" argument affects only the image being displayed in the
call to imshow. If you want all the images that you display using
imshow to appear without the gray border, set the Image Processing Toolbox
"ImshowBorder" preference to "tight". You can also
use preferences to include visible axes in the figure. For more information about
preferences, see iptprefs.
Display Image Using imageshow
This example reads the same image into the workspace and then displays the image in a
figure window using the imageshow function.
moon = imread("moon.tif");
imageshow(moon)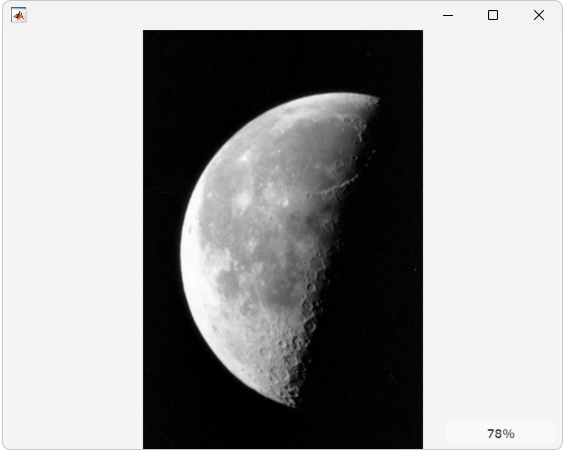
Similar to imshow, you can also specify the image to display as a
filename.
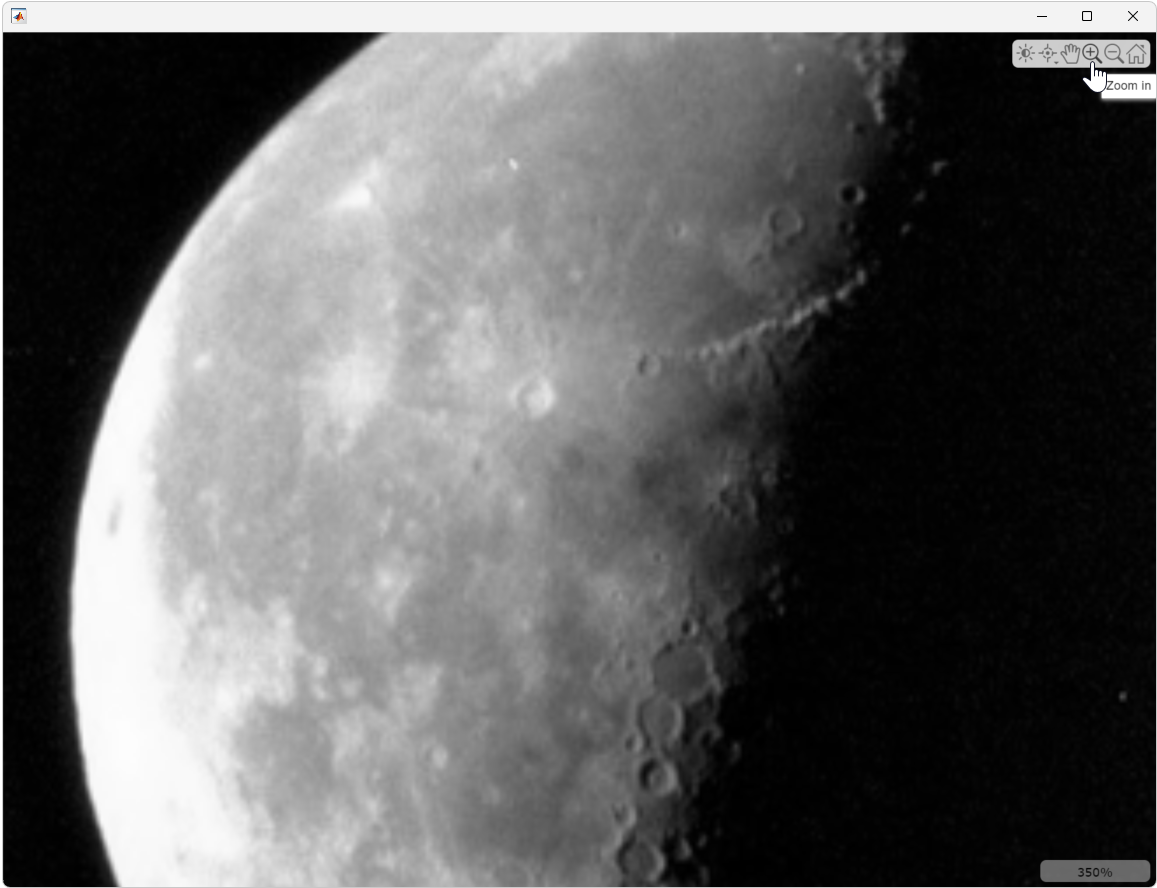
imageshow("moon.tif");The imageshow function displays the image in a viewer window. The
image zoom level is displayed in the bottom-right corner of the viewer. To increase the size
of the displayed image, maximize or manually drag the edge of the viewer to expand the
window. If you zoom in using the mouse scroll wheel or the zoom button on the toolbar, the
image expands to fill the viewer window. The scale bar updates to show the current zoom
level.
To optimize rendering quality at low and high zoom levels, the image interpolation
method changes automatically. At lower zoom levels, when one pixel of the image data spans
less than ten screen pixels, the image displays using bilinear interpolation. When one image
data pixel spans more than ten screen pixels, the image displays using nearest neighbor
interpolation. You can manually change the interpolation using the
Interpolation name-value argument.