Create Map Axes in App
This example shows how to include map axes in apps created using App Designer. The example also shows how to include app components that control the map projection and the visibility of plotted data.
To view an app created using the steps in this example, see App That Contains Map Axes.
Create New App
Open App Designer and click 2-Panel App with Auto-Reflow.
appdesigner
Create App Components
Add components to the left panel that control the map projection and the visibility of plotted data.
In the top-right corner of the center pane, select Design View to interactively add app components. Find the app components by browsing the Component Library. Change the appearance and behavior of app components by editing properties in the component tab of the Component Browser.
Create a component that controls the map projection.
Add a radio button group to the left panel.
Change the title of the group to
Map Projection.Change the text of the radio buttons to
Equal Earth,Winkel Tripel, andMercator.
Create a component that controls the visibility of plotted coastlines, rivers, and cities.
Add a panel to the left panel.
Change the title of the new panel to
Data.Add three check boxes to the
Datapanel.Change the text of the check boxes to
Coastlines,Rivers, andCities.Check each check box. For each check box, in the right pane, select Value.
Set Up Map
Add the map to the right panel.
In the top-right corner of the center pane, select Code View to add the map axes object, load and plot the data, and specify the map projections.
Create a map axes object.
Add a private property that stores the map axes object. Storing objects in properties enables you to access the objects throughout your app code. In the Editor tab, click Property and then Private Property. Then, change the property name in the
propertiesblock toMapAxesObject. Enable the app to validate the property value by including the class namemap.graphics.axis.MapAxes.properties (Access = private) MapAxesObject map.graphics.axis.MapAxes endAdd this code that creates a map when you start the app. In the Editor tab, click Callback. Set App to the application and Callback to
StartupFcn. Add code that enables the app to resize the map axes by adding a 1-by-1 grid to the right panel of the app. Create the map axes in the grid and store the map axes in theMapAxesObjectproperty. Disable panning and zooming by updating the interaction options of the map axes. (since R2024a) Then, provide geographic context by displaying world land areas in the map axes.function startupFcn(app) % Add 1-by-1 grid to right panel rightGrid = uigridlayout(app.RightPanel,[1 1]); % Create map axes app.MapAxesObject = mapaxes(rightGrid,NextPlot="add",Color="#A6A6A6"); % Disable panning and zooming app.MapAxesObject.InteractionOptions.PanSupported = "off"; app.MapAxesObject.InteractionOptions.ZoomSupported = "off"; % Display land areas land = readgeotable("landareas.shp"); geoplot(app.MapAxesObject,land,FaceColor="#d9d9d9",FaceAlpha=1, ... EdgeColor="none",HandleVisibility="off",PickableParts="none") end
Plot the coastlines, rivers, and cities data.
Add private properties that store the plot objects. In the Editor tab, select Property and then Private Property. Then, change the property name in the
propertiesblock toCoastlinesPolygonObject. Repeat this process to addRiversLineObjectandCitiesPointObjectproperties.properties (Access = private) % Previous code in properties block % ... CoastlinesPolygonObject map.graphics.chart.primitive.Polygon RiversLineObject map.graphics.chart.primitive.Line CitiesPointObject map.graphics.chart.primitive.Point endAdd this code that plots data when you start the app. Within the
StartupFcncallback, add code to plot the coastlines, rivers, and cities data in the map axes. Store the plots in theCoastlinesPolygonObject,RiversLineObject, andCitiesPointObjectproperties, respectively.function startupFcn(app) % Previous code in startup function % ... % Display coastlines, rivers, and cities rivers = readgeotable("worldrivers.shp"); cities = readgeotable("worldcities.shp"); app.CoastlinesPolygonObject = geoplot(app.MapAxesObject,land, ... EdgeColor="k",FaceColor="none"); app.RiversLineObject = geoplot(app.MapAxesObject,rivers,Color="#0072BD"); app.CitiesPointObject = geoplot(app.MapAxesObject,cities, ... MarkerEdgeColor="#A2142F"); end
Specify the map projections using projected coordinate reference system (CRS) objects.
Create the objects by using the projcrs function.
Add private properties that store the projected CRS objects. In the Editor tab, select Property and then Private Property. Then, change the property name in the
propertiesblock toEqualEarthProjectedCRS. Repeat this process to addWinkelTripelProjectedCRSandMercatorProjectedCRSproperties.properties (Access = private) % Previous code in properties block % ... EqualEarthProjectedCRS projcrs WinkelTripelProjectedCRS projcrs MercatorProjectedCRS projcrs endAdd this code that creates the projected CRS objects when you start the app. In the
StartupFcncallback, add code to createprojcrsobjects that use the Equal Earth, Winkel Tripel, and Mercator projections. Store the objects in theEqualEarthProjectedCRS,WinkelTripelProjectedCRS, andMercatorProjectedCRSproperties, respectively.function startupFcn(app) % Previous code in startup function % ... % Create projected CRSs app.EqualEarthProjectedCRS = projcrs(8857); app.WinkelTripelProjectedCRS = projcrs(54042,Authority="ESRI"); app.MercatorProjectedCRS = projcrs(54004,Authority="ESRI"); end
Program Component Behavior
Use Code View to program the behaviors of the radio button group and the check boxes.
Add this code that changes the projected CRS when you change the radio button selection. In the Editor tab, click Callback. Then, set Component to
MapProjectionButtonGroupand Callback toSelectionChangedFcn. Add code that changes the projected CRS of the map axes depending on the selected radio button.function MapProjectionButtonGroupSelectionChanged(app, event) % Change projected CRS of map axes based on selected map projection selectedButton = app.MapProjectionButtonGroup.SelectedObject; if selectedButton == app.EqualEarthButton % equal earth app.MapAxesObject.ProjectedCRS = app.EqualEarthProjectedCRS; elseif selectedButton == app.WinkelTripelButton % winkel tripel app.MapAxesObject.ProjectedCRS = app.WinkelTripelProjectedCRS; elseif selectedButton == app.MercatorButton % mercator app.MapAxesObject.ProjectedCRS = app.MercatorProjectedCRS; end end
Add this code that toggles that visibility of the plots when you check or uncheck the check boxes. In the Editor tab, click Callback. Then, set Component to
CoastlinesCheckBoxand Callback toValueChangedFcn. Add code that changes the visibility of the coastlines plot depending on the value of the check box.function CoastlinesCheckBoxValueChanged(app, event) % Change visibility of coastlines plot based on check box value = app.CoastlinesCheckBox.Value; app.CoastlinesPolygonObject.Visible = value; end
Repeat this step to add
ValueChangedFcncallbacks to the rivers check box,RiversCheckBox, and cities check box,CitiesCheckBox.
Run the App
To save and run the app, in the Editor tab, click Run. Change the map projection by clicking the radio buttons. Toggle the visibility of the coastlines, rivers, and cities by clicking the check boxes.
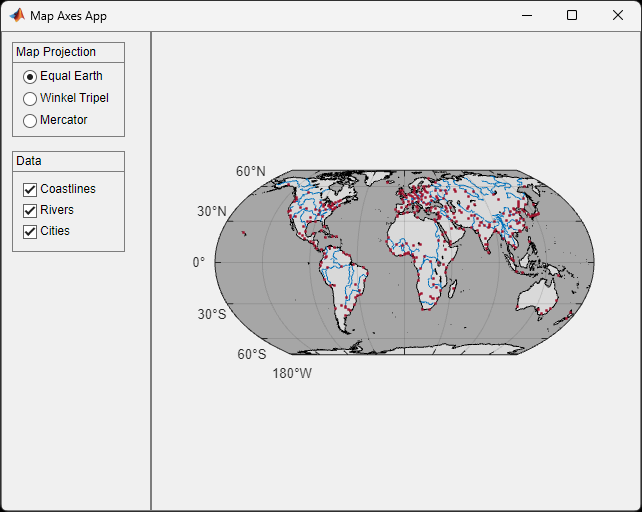
Example: App That Contains Map Axes
This app plots world coastlines, rivers, and cities into a map axes. Radio buttons enable you to change the map projection. Check boxes enable you to toggle the visibility of the plotted data.
To run the app, in the Editor tab, click Run. Alternatively, enter the name of the app, MapAxesApp, in the Command Window.