mapshape
Planar shape vector
Description
A mapshape vector is an object that represents planar vector features with either point, line, or polygon topology. The features consist of x- and y-coordinates and associated attributes.
Attributes that vary spatially are termed Vertex properties. These elements of the mapshape vector are coupled such that the length of the x- and y-coordinate property values are always equal in length to any additional dynamic Vertex properties.
Attributes that only pertain to the overall feature (point, line, polygon) are termed
Feature properties. Feature properties are not linked to the autosizing mechanism of the
Vertex properties. Both property types can be added to a mapshape vector after
construction using standard dot (.) notation.
To create a planar point, line, or polygon shape for use with a geospatial table,
create a mappointshape,
maplineshape,
or mappolyshape
object instead.
Creation
Syntax
Description
s = mapshape() constructs an empty mapshape vector,
s, with these default property
settings.
s =

 0x1 mapshape vector with properties:

 Collection properties:
    Geometry: 'line'
    Metadata: [1x1 struct]
 Vertex properties:
           X: []
           Y: []
s is always a column vector.
s = mapshape(
constructs a mapshape vector and sets the x,y)X and
Y property values equal to vectors x
and y.
s = mapshape(
constructs a mapshape vector, then adds dynamic properties to the mapshape
vector using x,y,Name,Value)Name, Value argument
pairs. You can specify several name-value pair arguments in any order as
Name1,Value1,...,NameN,ValueN.
s = mapshape( constructs
a structArray)mapshape vector, assigning the fields of the structure
array, structArray, as dynamic properties. Field values in
structArray that are not numeric, logical, string
scalars, string arrays, character vectors, cell arrays of character vectors, or
cell arrays of numeric, logical, or cell array of character vectors values are
ignored. You can specify vectors within cell arrays as either row or column
vectors.
s = mapshape(
constructs a new x,y,structArray)mapshape vector, sets the
X and Y properties equal to vectors
x and y, and sets dynamic
properties from the field values of structArray.
Properties
Object Functions
append | Append features to geographic or planar vector |
cat | Concatenate geographic or planar vector |
disp | Display geographic or planar vector |
fieldnames | Return dynamic property names of geographic or planar vector |
isempty | Determine if geographic or planar vector is empty |
isfield | Determine if dynamic property exists in geographic or planar vector |
isprop | Determine if property exists in geographic or planar vector |
length | Return number of elements in geographic or planar vector |
properties | Return property names of geographic or planar vector |
rmfield | Remove dynamic property from geographic or planar vector |
rmprop | Remove property from geographic or planar vector |
size | Return size of geographic or planar vector |
struct | Convert geographic or planar vector to scalar structure |
vertcat | Vertically concatenate geographic or planar vectors |
Examples
Create default mapshape vector.
s = mapshape()
0x1 mapshape vector with properties:

 Collection properties:
    Geometry: 'line'
    Metadata: [1x1 struct]
 Vertex properties:
           X: []
           Y: []
Set the values of the existing X and
Y properties and dynamically add the Vertex property
Z.
s(1).X = 0:45:90;
s(1).Y= [10 10 10];
s(1).Z = [10 20 30]
s =

 1x1 mapshape vector with properties:

 Collection properties:
    Geometry: 'line'
    Metadata: [1x1 struct]
 Vertex properties:
           X: [0 45 90]
           Y: [10 10 10]
Z: [10 20 30]Create a mapshape vector specifying x and y.
x = [40, 50, 60];
y = [10, 20, 30];
shape = mapshape(x, y)
shape =

 1x1 mapshape vector with properties:

 Collection properties:
    Geometry: 'line'
    Metadata: [1x1 struct]
 Vertex properties:
           X: [40 50 60]
Y: [10 20 30]Create mapshape vector specifying a Name-Value pair.
x = 1:10;
y = 21:30;
temperature = {61:70};
shape = mapshape(x, y, 'Temperature', temperature)
shape =
1x1 mapshape vector with properties:
Collection properties:
Geometry: 'line'
Metadata: [1x1 struct]
Vertex properties:
X: [1 2 3 4 5 6 7 8 9 10]
Y: [21 22 23 24 25 26 27 28 29 30]
Temperature: [61 62 63 64 65 66 67 68 69 70]When Value is a cell array containing numeric, logical,
or cell array of character vectors, it is designated as a Vertex property.
Otherwise the Name-Value pair is designated as being a Feature
property.
Read a shapefile into the workspace as a structure array. Then, create a mapshape vector from the structure array.
structArray = shaperead("concord_roads.shp");
shape = mapshape(structArray);Read a shapefile into the workspace as two structure arrays. The first structure array contains the features, and the second structure array contains attributes of the features. Extract the xy-coordinates from the structure array of features.
[structArray,A] = shaperead("concord_hydro_area.shp");
X = {structArray.X};
Y = {structArray.Y};
Create a mapshape vector from the coordinates and the attributes. Specify the geometry of the mapshape vector using the geometry of the features.
shape = mapshape(X,Y,A);
shape.Geometry = structArray(1).Geometry;
This example shows how to add a single feature after
construction of the mapshape vector using dot (.)
notation.
Create a mapshape vector.
x = 0:10:100;
y = 0:10:100;
shape = mapshape(x, y)
shape =

 1x1 mapshape vector with properties:

 Collection properties:
    Geometry: 'line'
    Metadata: [1x1 struct]
 Vertex properties:
           X: [0 10 20 30 40 50 60 70 80 90 100]
           Y: [0 10 20 30 40 50 60 70 80 90 100]
Add a dynamic Feature property.
shape.FeatureName = 'My Feature'shape =
1x1 mapshape vector with properties:
Collection properties:
Geometry: 'line'
Metadata: [1x1 struct]
Vertex properties:
X: [0 10 20 30 40 50 60 70 80 90 100]
Y: [0 10 20 30 40 50 60 70 80 90 100]
Feature properties:
FeatureName: 'My Feature'Add a dynamic Vertex property to the first feature.
shape(1).Temperature = [60 61 63 65 66 68 69 70 72 75 80];
shape =

 1x1 mapshape vector with properties:

 Collection properties:
       Geometry: 'line'
       Metadata: [1x1 struct]
 Vertex properties:
              X: [0 10 20 30 40 50 60 70 80 90 100]
              Y: [0 10 20 30 40 50 60 70 80 90 100]
    Temperature: [60 61 63 65 66 68 69 70 72 75 80]
 Feature properties:
FeatureName: 'My FeatureThis extended example adds multiple features that are both Vertex and Feature properties. It also demonstrates property behaviors when vector lengths are either changed or set to [ ].
Create a mapshape vector.
x = {1:3, 4:6};
y = {[0 0 0], [1 1 1]};
shape = mapshape(x, y)
shape =

 2x1 mapshape vector with properties:

 Collection properties:
    Geometry: 'line'
    Metadata: [1x1 struct]
 Vertex properties:
  (2 features concatenated with 1 delimiter)
           X: [1 2 3 NaN 4 5 6]
           Y: [0 0 0 NaN 1 1 1]
Add a two element dynamic Feature property.
shape.FeatureName = {'Feature 1', 'Feature 2'}shape =
2x1 mapshape vector with properties:
Collection properties:
Geometry: 'line'
Metadata: [1x1 struct]
Vertex properties:
(2 features concatenated with 1 delimiter)
X: [1 2 3 NaN 4 5 6]
Y: [0 0 0 NaN 1 1 1]
Feature properties:
FeatureName: {'Feature 1' 'Feature 2'}Add a dynamic Vertex property.
z = {101:103, [115, 114, 110]}
shape.Z = z
z =

    [1x3 double]    [1x3 double]


shape =

 2x1 mapshape vector with properties:

 Collection properties:
       Geometry: 'line'
       Metadata: [1x1 struct]
 Vertex properties:
  (2 features concatenated with 1 delimiter)
              X: [1 2 3 NaN 4 5 6]
              Y: [0 0 0 NaN 1 1 1]
              Z: [101 102 103 NaN 115 114 110]
 Feature properties:
    FeatureName: {'Feature 1' 'Feature 2'}
Display the second feature.
shape(2)
ans =

 1x1 mapshape vector with properties:

 Collection properties:
       Geometry: 'line'
       Metadata: [1x1 struct]
 Vertex properties:
              X: [4 5 6]
              Y: [1 1 1]
              Z: [115 114 110]
 Feature properties:
    FeatureName: 'Feature 2'
Add a third feature. The lengths of all the properties are synchronized.
shape(3).X = 5:9
shape =

 3x1 mapshape vector with properties:

 Collection properties:
       Geometry: 'line'
       Metadata: [1x1 struct]
 Vertex properties:
  (3 features concatenated with 2 delimiters)
              X: [1 2 3 NaN 4 5 6 NaN 5 6 7 8 9]
              Y: [0 0 0 NaN 1 1 1 NaN 0 0 0 0 0]
              Z: [101 102 103 NaN 115 114 110 NaN 0 0 0 0 0]
 Feature properties:
    FeatureName: {'Feature 1' 'Feature 2' ''}
Set the values for the Z vertex property with fewer
values than contained in X or Y. The
Z values expand to match the length of
X and Y.
shape(3).Z = 1:3
shape =

 3x1 mapshape vector with properties:

 Collection properties:
       Geometry: 'line'
       Metadata: [1x1 struct]
 Vertex properties:
  (3 features concatenated with 2 delimiters)
              X: [1 2 3 NaN 4 5 6 NaN 5 6 7 8 9]
              Y: [0 0 0 NaN 1 1 1 NaN 0 0 0 0 0]
              Z: [101 102 103 NaN 115 114 110 NaN 1 2 3 0 0]
 Feature properties:
    FeatureName: {'Feature 1' 'Feature 2' ''}
Set the values for either coordinate property (X or
Y) and all properties shrink in size to match the new
vertex length of that feature.
shape(3).Y = 1
shape =

 3x1 mapshape vector with properties:

 Collection properties:
       Geometry: 'line'
       Metadata: [1x1 struct]
 Vertex properties:
  (3 features concatenated with 2 delimiters)
              X: [1 2 3 NaN 4 5 6 NaN 5]
              Y: [0 0 0 NaN 1 1 1 NaN 1]
              Z: [101 102 103 NaN 115 114 110 NaN 1]
 Feature properties:
    FeatureName: {'Feature 1' 'Feature 2' ''}
Set the values for the Z vertex property with more
values than contained in X or Y. All
properties expand in length to match Z.
shape(3).Z = 1:6
shape =

 3x1 mapshape vector with properties:

 Collection properties:
       Geometry: 'line'
       Metadata: [1x1 struct]
 Vertex properties:
  (3 features concatenated with 2 delimiters)
              X: [1 2 3 NaN 4 5 6 NaN 5 0 0 0 0 0]
              Y: [0 0 0 NaN 1 1 1 NaN 1 0 0 0 0 0]
              Z: [101 102 103 NaN 115 114 110 NaN 1 2 3 4 5 6]
 Feature properties:
    FeatureName: {'Feature 1' 'Feature 2' ''}
Remove the FeatureName property.
shape.FeatureName = []
shape =

 3x1 mapshape vector with properties:

 Collection properties:
    Geometry: 'line'
    Metadata: [1x1 struct]
 Vertex properties:
  (3 features concatenated with 2 delimiters)
           X: [1 2 3 NaN 4 5 6 NaN 5 0 0 0 0 0]
           Y: [0 0 0 NaN 1 1 1 NaN 1 0 0 0 0 0]
           Z: [101 102 103 NaN 115 114 110 NaN 1 2 3 4 5 6]
Remove all dynamic properties and set the object to empty.
shape.X = []
shape =

 0x1 mapshape vector with properties:

 Collection properties:
    Geometry: 'line'
    Metadata: [1x1 struct]
 Vertex properties:
           X: []
Y: []This example shows how to include multiple dynamic features during object construction.
Create a mapshape vector specifying several name-value pairs.
x = {1:3, 4:6};
y = {[0 0 0], [1 1 1]};
z = {41:43, [56 50 59]};
name = {'Feature 1', 'Feature 2'};
id = [1 2];
shape = mapshape(x, y, 'Z', z, 'Name', name, 'ID', id)
shape =
2x1 mapshape vector with properties:
Collection properties:
Geometry: 'line'
Metadata: [1x1 struct]
Vertex properties:
(2 features concatenated with 1 delimiter)
X: [1 2 3 NaN 4 5 6]
Y: [0 0 0 NaN 1 1 1]
Z: [41 42 43 NaN 56 50 59]
Feature properties:
Name: {'Feature 1' 'Feature 2'}
ID: [1 2]Load the data and create x, y, and
z arrays. Create a level list to use to bin the
z values.
seamount = load('seamount');
x = seamount.x; y = seamount.y; z = seamount.z;

levels = [unique(floor(seamount.z/1000)) * 1000; 0];
Construct a mapshape object and assign the X and
Y Vertex properties to the binned
x and y values. Create a new
Z Vertex property to contain the binned
z values. Add a Levels Feature
property to contain the lowest level value per feature.
shape = mapshape;
for k = 1:length(levels) - 1
   index = z >= levels(k) & z < levels(k+1);
   shape(k).X = x(index);
   shape(k).Y = y(index);
   shape(k).Z = z(index);
   shape(k).Level = levels(k);
end
Add a Color Feature property to denote a color for that
feature, and specify that the geometry is 'point'
shape.Color = {'red', 'green', 'blue', 'cyan', 'black'};
shape.Geometry = 'point'
shape =
5x1 mapshape vector with properties:
Collection properties:
Geometry: 'point'
Metadata: [1x1 struct]
Vertex properties:
(5 features concatenated with 4 delimiters)
X: [1x298 double]
Y: [1x298 double]
Z: [1x298 double]
Feature properties:
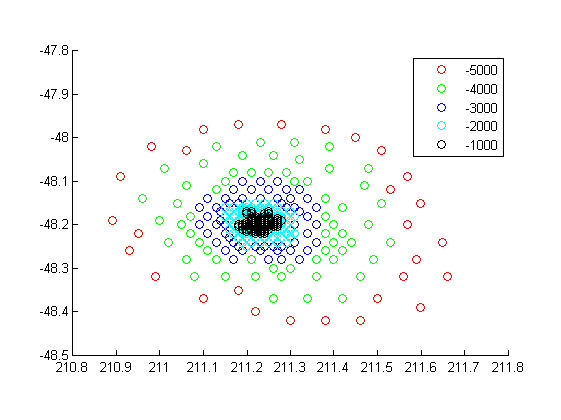
Level: [-5000 -4000 -3000 -2000 -1000]
Color: {'red' 'green' 'blue' 'cyan' 'black'} Add metadata information. Metadata is a scalar
structure containing information for the entire set of properties. Any type
of data may be added to the structure.
shape.Metadata.Caption = seamount.caption;
shape.Metadata
ans =

    Caption: [1x229 char]
Display the point data in 2-D.
figure
for k=1:length(shape)
  mapshow(shape(k).X, shape(k).Y, ...
   'MarkerEdgeColor', shape(k).Color, ...
   'Marker', 'o', ...
   'DisplayType', shape.Geometry)
end
legend(num2str(shape.Level'))
Display data as a 3-D scatter plot.
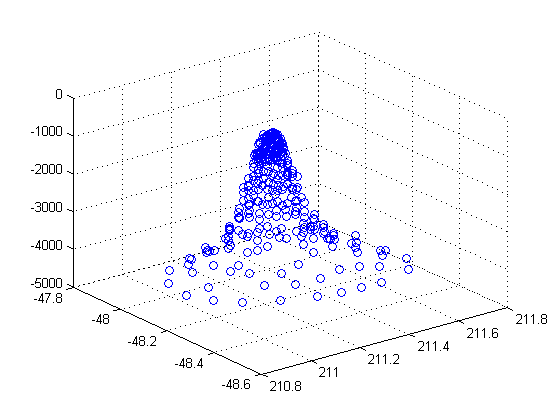
figure
scatter3(shape.X, shape.Y, shape.Z)
Read a shapefile of road data into the workspace as a structure array. Create a mapshape vector from the structure array.
filename = "concord_roads.shp";
structArray = shaperead(filename);
shape = mapshape(structArray);
Add a Filename field to the Metadata structure.
shape.Metadata.Filename = filename;
Create a new mapshape vector that contains only CLASS 4 roads.
idx = shape.CLASS == 4;
class4 = shape(idx);
Read a shapefile into the workspace as a structure array. Then, create a mapshape vector from the structure array.
structArray = shaperead("tsunamis.shp");
shape = mapshape(structArray);
Sort the dynamic properties so they are in alphabetical order.
fn = fieldnames(shape);
shape = shape(:,sort(fn));
Create a new mapshape vector that contains these dynamic properties: 'Year', 'Month', 'Day', 'Hour', and 'Minute'.
dp = {'Year','Month','Day','Hour','Minute'};
shape2 = shape(:,dp);
Create a new mapshape vector where each feature contains points for the same year. To ensure that NaN feature separators are not included, copy the data from a mappoint vector. Subset the data so that the mapshape vector contains only 'Year' and 'Country' dynamic properties.
points = mappoint(structArray);
points = points(:, {'Year', 'Country'});
years = unique(points.Year);
multipoint = mapshape();
multipoint.Geometry = "point";

for k = 1:length(years)
   index = points.Year == years(k);
   multipoint(k).X = points(index).X;
   multipoint(k).Y = points(index).Y;
   multipoint(k).Year = years(k);
   multipoint(k).Country = points(index).Country;
end
Display the third feature from the end.
multipoint(end-3)
ans =
 1×1 mapshape vector with properties:

 Collection properties:
    Geometry: 'point'
    Metadata: [1×1 struct]
 Vertex properties:
           X: [3.6340 -62.1800 143.9100]
           Y: [36.9640 16.7220 41.8150]
     Country: {'ALGERIA'  'MONTSERRAT'  'JAPAN'}
 Feature properties:
        Year: 2003
More About
Tips
The
mapshapefunction separates features usingNaNvalues. If you display a feature by using a scalar to index into the mapshape vector, such ass(1), thenNaNvalues that separate the features do not display.If
X,Y, or a dynamic property is set with more values than features in the mapshape vector, then all other properties expand in size using 0 for numeric values and an empty character vector ('') for cell values.If a dynamic property is set with fewer values than the number of features, then this dynamic property expands to match the size of the other properties.
If the
XorYproperty of the mapshape vector is set with fewer values than contained in the object, then all other properties shrink in size.If either
XorYis set to [ ], then both coordinate properties are set to [ ] and all dynamic properties are removed.If a dynamic property is set to [ ], then it is removed from the object.
The mapshape vector can be indexed like any MATLAB® vector. You can access any element of the vector to obtain a specific feature. The following example demonstrates this behavior:
Construct a Mapshape Vector Containing Multiple Features and Indexing Behaviors
This example builds a mapshape vector from a structure array; adds a Metadata property and demonstrates selective indexing behavior. Create mapshape Vector, Index into Vector, and Add Metadata
Version History
Introduced in R2012a