quiverm
Project 2-D quiver plot on axesm-based map
Syntax
Description
quiverm(
creates a quiver plot on the current lat,lon,dlat,dlon)axesm-based map. The quiver plot
has arrows with directional components dlat and
dlon at the geographic coordinates specified by
lat and lon. For example, the first arrow
originates from the point lat(1) and lon(1),
extends horizontally according to dlon(1), and extends vertically
according to dlat(1). By default, the function scales the arrow lengths
so that they do not overlap.
quiverm(
adjusts the lengths of the arrows:lat,lon,dlat,dlon,scale)
When
scaleis a positive number, the function automatically adjusts the lengths of arrows so they do not overlap, then stretches them by a factor ofscale. For example, ascaleof2doubles the length of arrows, and ascaleof0.5halves the length of arrows.When
scaleis"off"or0, such asquiverm(lat,lon,dlat,dlon,"off"), the function does not perform automatic scaling.
h = quiverm(___)
Examples
Load sample data that represents air currents into the workspace, and select a subset of the data.
load("wind","x","y","u","v")
lat = y(11:22,11:22,1);
lon = x(11:22,11:22,1);
dlat = v(11:22,11:22,1);
dlon = u(11:22,11:22,1);
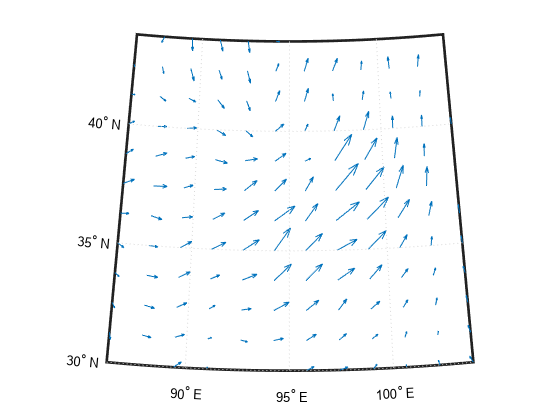
Create a map and display a quiver plot of the subset you selected. The matrices lat and lon represent the location of the base of each arrow, and dlat and dlon represent the directional components of each arrow. By default, the quiverm function shortens the arrows so they do not overlap.
figure
[latlim,lonlim] = geoquadline(lat,lon);
usamap(latlim,lonlim)

quiverm(lat,lon,dlat,dlon)
Input Arguments
Line style, marker, and color, specified as a character vector or string scalar containing symbols. The symbols can appear in any order. You do not need to specify all three characteristics (line style, marker, and color).
If you specify a marker using LineSpec, then the
quiverm function does not display arrowheads.
Example: "--or" is a red dashed line with circle
markers
| Line Style | Description | Resulting Line |
|---|---|---|
"-" | Solid line |
|
"--" | Dashed line |
|
":" | Dotted line |
|
"-." | Dash-dotted line |
|
| Marker | Description | Resulting Marker |
|---|---|---|
"o" | Circle |
|
"+" | Plus sign |
|
"*" | Asterisk |
|
"." | Point |
|
"x" | Cross |
|
"_" | Horizontal line |
|
"|" | Vertical line |
|
"square" | Square |
|
"diamond" | Diamond |
|
"^" | Upward-pointing triangle |
|
"v" | Downward-pointing triangle |
|
">" | Right-pointing triangle |
|
"<" | Left-pointing triangle |
|
"pentagram" | Pentagram |
|
"hexagram" | Hexagram |
|
| Color Name | Short Name | RGB Triplet | Appearance |
|---|---|---|---|
"red" | "r" | [1 0 0] |
|
"green" | "g" | [0 1 0] |
|
"blue" | "b" | [0 0 1] |
|
"cyan"
| "c" | [0 1 1] |
|
"magenta" | "m" | [1 0 1] |
|
"yellow" | "y" | [1 1 0] |
|
"black" | "k" | [0 0 0] |
|
"white" | "w" | [1 1 1] |
|
Arrow scaling factor, specified as a nonnegative scalar or "off".
By default, the quiverm function automatically scales the arrows so
they do not overlap. The quiverm function applies the specified
scaling factor after it automatically scales the arrows.
To turn off automatic scaling, specify scale as
"off" or 0. When you specify either of these
values, the function plots the arrows from (lat,
lon) to (lat+dlat,
lon+dlon).
Output Arguments
Version History
Introduced before R2006a