Thematic Maps
Thematic maps portray attributes of locations and features. For example, you can use a choropleth map to show election results by state, a contour plot to show aircraft visibility at different elevations, and a bubble chart to show populations for different cities.
Functions
Topics
- Thematic Maps
Thematic maps portray attributes of locations and features. For example, a thematic map could show the population density by region, or election results by state.
- Create Choropleth Map of Population Density
This example shows how to create a choropleth map, in which the color of each state represents the population density of the state.
Featured Examples
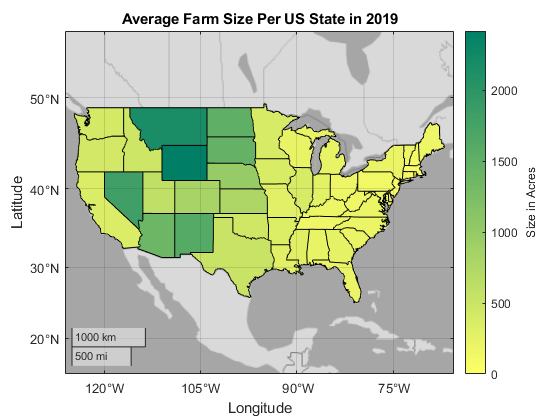
Create Choropleth Map from Table Data
Create a map that illustrates numeric attributes using colors along a gradient.
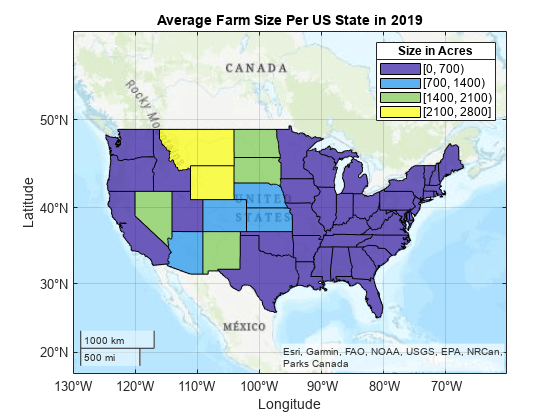
Create Classification Map from Table Data
Create a map that illustrates categorical attributes using discrete colors.