Code Quality Dashboard
Description
Use the Code Quality Dashboard to view project quality metrics, including code analysis, test and code coverage results, and requirements verification status.
Open the Code Quality Dashboard App
Open a project, then use one of these approaches to open the app:
MATLAB® Toolstrip: In the Project tab, in the Tools menu, under Apps, click Code Quality Dashboard.
MATLAB command prompt: Enter
codeQualityDashboard
.
Examples
Collect Test and Requirements Metric Results
This example shows how to collect test and requirements metric results and reflect the results in the Code Quality Dashboard.
Open the MATLABShortestPath
project.
openProject("MATLABShortestPath");
Open the Code Quality Dashboard.
codeQualityDashboard
Run all tests in the project by clicking the Run button .
Collect Coverage Metric Results
This example shows how to collect coverage metric results and reflect the results in the Code Quality Dashboard.
Open the MATLABShortestPath
project.
openProject("MATLABShortestPath");
Open the MATLAB Test Manager.
matlabTestManager
In the toolstrip, click the Code Coverage button and select Enable code coverage, then set the coverage metric level to MC/DC.
Open the Code Quality Dashboard.
codeQualityDashboard
Run tests and collect coverage by clicking the Run button .
Programmatically Update, Get, and Export Code Quality Dashboard Metrics
This example shows how to update, get, and export metrics from the Code Quality Dashboard.
Open the ShortestPath
project.
openProject("MATLABShortestPath");
Open the Code Quality Dashboard.
codeQualityDashboard
Run the tests in the project, collect coverage for the tests, verify the requirements, and update the metrics in the dashboard.
matlabtest.codequalitydashboard.runTestsAndRefreshData
pathLength = 3
Get the metrics from the Code Quality Dashboard.
metrics = matlabtest.codequalitydashboard.getMetrics
metrics = struct with fields:
ProjectPath: "C:\Users\jdoe\MATLAB\MATLABShortestPath"
Metrics: [1×1 struct]
Export the metrics to a JSON file.
filePath = matlabtest.codequalitydashboard.exportMetrics
filePath = "C:\Users\jdoe\MATLAB\MATLABShortestPath\CodeQualityMetrics.json"
Open Requirement Sets in the Current Project
If you have Requirements Toolbox™, you can open the requirement sets in the current project in the Requirements Editor (Requirements Toolbox).
To open the requirement sets, open the Code Quality Dashboard and click the Requirements section.
If you have loaded requirement sets that are not in the current project, a dialog box prompts you to save and close them. (since R2024b)
The Requirements Editor (Requirements Toolbox) opens and displays the loaded requirement sets.
Generate Traceability Matrix for Requirements and Tests in Current Project
Since R2024b
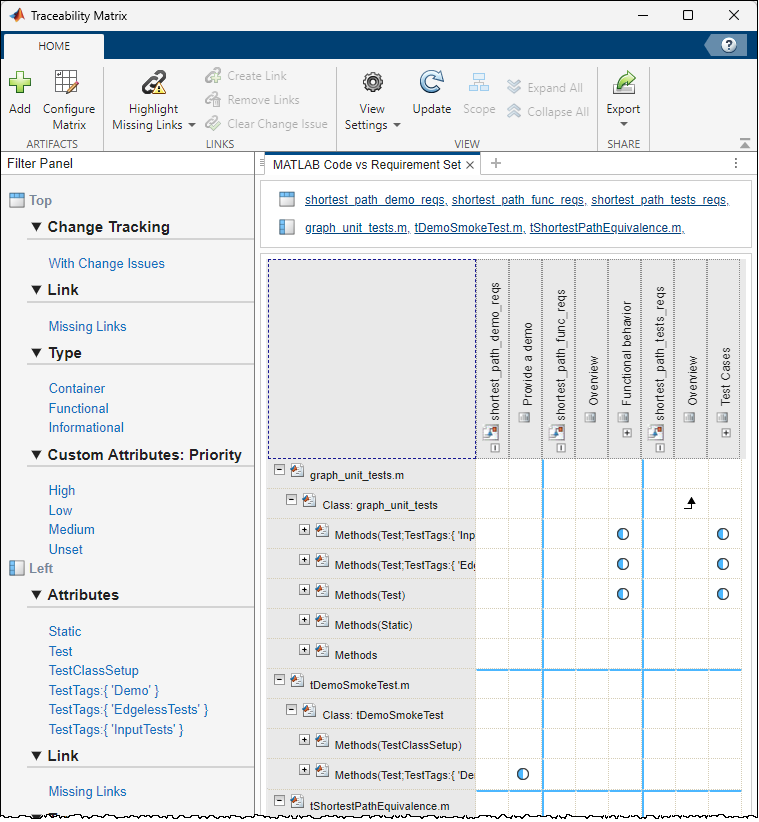
If you have Requirements Toolbox, you can generate a traceability matrix that contains the requirement sets and MATLAB tests in the current project.
To generate the traceability matrix, open the Code Quality Dashboard. Then, in the Requirements section, click the three-dot icon and select Generate Traceability Matrix.
If you have loaded requirement sets that are not in the current project, a dialog box prompts you to save and close them.
The Traceability Matrix window opens and displays the loaded requirement sets on the top and the tests on the left.
For more information about traceability matrices, see Track Requirement Links with a Traceability Matrix (Requirements Toolbox).
Version History
Introduced in R2023aR2024b: Open requirement sets in current project
If you have Requirements Toolbox, you can open the requirement sets in the current project by clicking the Requirements section in the dashboard.
R2024b: Generate traceability matrix for requirements and tests in the current project
If you have Requirements Toolbox, you can generate a traceability matrix that contains the requirement sets and MATLAB tests in the current project. In the dashboard, in the Requirements section, click the three-dot icon and select Generate Traceability Matrix.
R2024b: View code coverage results for generated C/C++ code
If you have Embedded Coder®, you can use the MATLAB Test Manager to collect coverage for generated C/C++ code that you execute in SIL and PIL equivalence tests. View a summary of the coverage results in the Generated Code Coverage section and open an HTML coverage report by clicking the section.
R2024a: Run tests by using the Code Quality Dashboard
Run tests by using the Run button . Stop the tests from running to completion by clicking the Stop button .
R2023b: View timestamps for metric results in the Code Quality Dashboard
Each section of the Code Quality Dashboard displays a timestamp that indicates when the software collected the results.
R2023b: View tests and results from referenced projects in the Code Quality Dashboard
When a parent project references other projects, the Code Quality Dashboard collects and displays quality metrics for the parent project and its referenced projects.
See Also
Apps
Functions
Comando MATLAB
Hai fatto clic su un collegamento che corrisponde a questo comando MATLAB:
Esegui il comando inserendolo nella finestra di comando MATLAB. I browser web non supportano i comandi MATLAB.
Select a Web Site
Choose a web site to get translated content where available and see local events and offers. Based on your location, we recommend that you select: .
You can also select a web site from the following list:
How to Get Best Site Performance
Select the China site (in Chinese or English) for best site performance. Other MathWorks country sites are not optimized for visits from your location.
Americas
- América Latina (Español)
- Canada (English)
- United States (English)
Europe
- Belgium (English)
- Denmark (English)
- Deutschland (Deutsch)
- España (Español)
- Finland (English)
- France (Français)
- Ireland (English)
- Italia (Italiano)
- Luxembourg (English)
- Netherlands (English)
- Norway (English)
- Österreich (Deutsch)
- Portugal (English)
- Sweden (English)
- Switzerland
- United Kingdom (English)