Modifica dello schema di colori utilizzando una mappa dei colori
MATLAB® utilizza uno schema di colori predefinito per la visualizzazione di grafici come quelli a superficie. È possibile modificare lo schema di colori specificando una mappa dei colori. Le mappe dei colori sono array a tre colonne contenenti triplette RGB in cui ogni riga definisce un colore distinto.
Ad esempio, ecco un grafico di superficie con lo schema di colori predefinito.
f = figure;
surf(peaks);

Il comando seguente modifica la mappa dei colori della figura attuale in winter, una delle diverse mappe dei colori predefinite (vedere Colore e stile per un elenco completo).
colormap winter;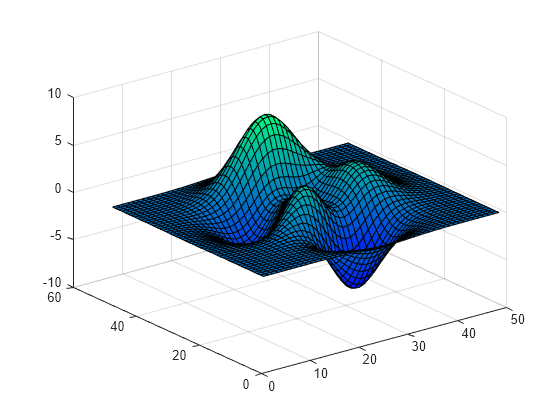
Se sono aperte più figure, passare l'oggetto Figure come primo argomento alla funzione colormap.
colormap(f,hot);

Per impostazione predefinita, ogni mappa dei colori predefinita fornisce una tavolozza di 256 colori. Tuttavia, è possibile specificare un numero qualsiasi di colori passando un numero intero alla funzione colormap predefinita. Ad esempio, ecco la mappa dei colori hot con dieci voci.
c = hot(10);
colormap(c);

È inoltre possibile creare una mappa dei colori personalizzata come array m x 3. Ogni riga dell’array contiene le intensità di rosso, verde e blu di un colore diverso. Le intensità sono comprese nell'intervallo [0,1]. Ecco una semplice mappa dei colori che contiene tre voci.
mycolors = [1 0 0; 1 1 0; 0 0 1];
colormap(mycolors);

Se si lavora con più assi, è possibile assegnare una mappa dei colori diversa a ciascun asse passando l'oggetto assi alla funzione colormap.
tiledlayout(1,2)
ax1 = nexttile;
surf(peaks);
shading interp;
colormap(ax1,parula(10));

ax2 = nexttile;
surf(peaks);
shading interp;
colormap(ax2,cool(10));
