csgdel
Delete boundaries between subdomains
Description
[
deletes the boundaries dl1,bt1] = csgdel(dl,bt,bl)bl between subdomains. If deleting the boundaries
in bl makes the decomposed geometry matrix inconsistent, then
csgdel deletes additional border segments (edge segments between
subdomains) to preserve consistency.
Deleting boundaries typically changes the edge IDs of the remaining boundaries.
csgdel does not delete boundary segments (outer boundaries).
Examples
Delete edges in a 2-D geometry created in the PDE Modeler app and exported to the MATLAB® workspace.
Create a geometry in the PDE Modeler app by entering the following commands in the MATLAB Command Window:
pdecirc(0,0,1,"C1") pdecirc(0,0,0.5,"C2") pderect([-0.2 0.2 0.2 0.9],"R1") pderect([0 1 0 1],"SQ1")
Reduce the geometry to the first quadrant by intersecting it with a square. To do
this, enter (C1+C2+R1)*SQ1 in the Set formula
field.
From the PDE Modeler app, export the geometry description matrix, set formula, and name-space matrix to the MATLAB workspace by selecting Export Geometry Description, Set Formula, Labels from the Draw menu.
In the MATLAB Command Window, use the decsg function to decompose the exported geometry into minimal regions.
This creates an AnalyticGeometry object dl. Plot
dl.
[dl,bt] = decsg(gd,sf,ns); pdegplot(dl,"EdgeLabels","on","FaceLabels","on") xlim([-0.1 1.1]) ylim([-0.1 1.1])

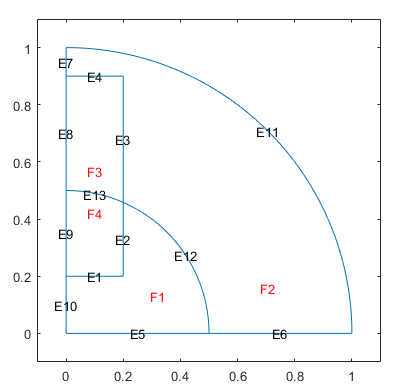
Remove edges 1, 2, and 13 using the csgdel function. Specify the
edges to delete as a vector of edge IDs. Plot the resulting geometry.
[dl1,bt1] = csgdel(dl,bt,[1 2 13]); pdegplot(dl1,"EdgeLabels","on","FaceLabels","on") xlim([-0.1 1.1]) ylim([-0.1 1.1])

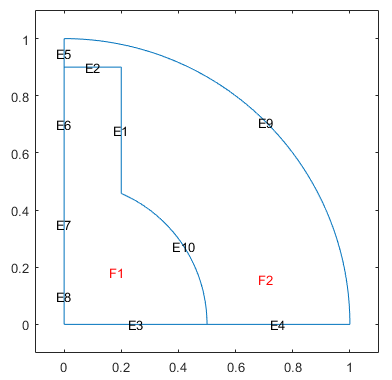
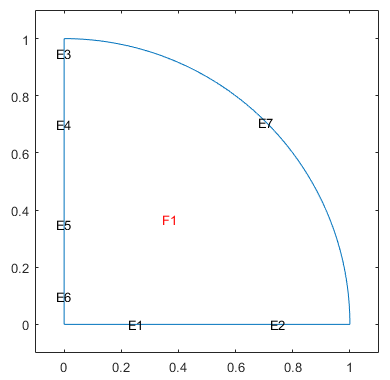
Now remove all boundaries between subdomains and plot the resulting geometry.
[dl1,bt1] = csgdel(dl,bt); pdegplot(dl1,"EdgeLabels","on","FaceLabels","on") xlim([-0.1 1.1]) ylim([-0.1 1.1])

Input Arguments
Decomposed geometry matrix, returned as a matrix of double-precision numbers. It
contains a representation of the decomposed geometry in terms of disjointed minimal
regions constructed by the decsg algorithm. Each edge segment of
the minimal regions corresponds to a column in dl. Edge segments
between minimal regions (subdomains) are border segments. Outer
boundaries are boundary segments. In each column, the second and
third rows contain the starting and ending x-coordinates. The fourth
and fifth rows contain the corresponding y-coordinates. The sixth and
seventh rows contain left and right minimal region labels with respect to the direction
induced by the start and end points (counterclockwise direction on circle and ellipse
segments). There are three types of possible edge segments in a minimal region:
For circle edge segments, the first row is
1. The eighth and ninth rows contain the coordinates of the center of the circle. The 10th row contains the radius.For line edge segments, the first row is
2.For ellipse edge segments, the first row is
4. The eighth and ninth rows contain the coordinates of the center of the ellipse. The 10th and 11th rows contain the semiaxes of the ellipse. The 12th row contains the rotational angle of the ellipse.
All columns in a decomposed geometry matrix have the same number of rows. Rows that are not required for a particular shape are filled with zeros.
| Row number | Circle edge segment | Line edge segment | Ellipse edge segment |
|---|---|---|---|
| 1 | 1 | 2 | 4 |
| 2 | starting x-coordinate | starting x-coordinate | starting x-coordinate |
| 3 | ending x-coordinate | ending x-coordinate | ending x-coordinate |
| 4 | starting y-coordinate | starting y-coordinate | starting y-coordinate |
| 5 | ending y-coordinate | ending y-coordinate | ending y-coordinate |
| 6 | left minimal region label | left minimal region label | left minimal region label |
| 7 | right minimal region label | right minimal region label | right minimal region label |
| 8 | x-coordinate of the center | x-coordinate of the center | |
| 9 | y-coordinate of the center | y-coordinate of the center | |
| 10 | radius of the circle | x-semiaxis before rotation | |
| 11 | y-semiaxis before rotation | ||
| 12 | Angle in radians between x-axis and first semiaxis |
Data Types: double
Boolean table relating the original shapes to the minimal regions, returned as a matrix of 1s and 0s.
Data Types: double
Boundaries to delete, specified as a positive integer or a vector of positive integers. Each integer represents a boundary ID.
Data Types: double
Output Arguments
Modified decomposed geometry matrix, returned as a matrix of double-precision numbers.
Data Types: double
Boolean table relating the remaining original shapes to the minimal regions, returned as a matrix of 1s and 0s.
Data Types: double
Version History
Introduced before R2006a
See Also
MATLAB Command
You clicked a link that corresponds to this MATLAB command:
Run the command by entering it in the MATLAB Command Window. Web browsers do not support MATLAB commands.
Seleziona un sito web
Seleziona un sito web per visualizzare contenuto tradotto dove disponibile e vedere eventi e offerte locali. In base alla tua area geografica, ti consigliamo di selezionare: .
Puoi anche selezionare un sito web dal seguente elenco:
Come ottenere le migliori prestazioni del sito
Per ottenere le migliori prestazioni del sito, seleziona il sito cinese (in cinese o in inglese). I siti MathWorks per gli altri paesi non sono ottimizzati per essere visitati dalla tua area geografica.
Americhe
- América Latina (Español)
- Canada (English)
- United States (English)
Europa
- Belgium (English)
- Denmark (English)
- Deutschland (Deutsch)
- España (Español)
- Finland (English)
- France (Français)
- Ireland (English)
- Italia (Italiano)
- Luxembourg (English)
- Netherlands (English)
- Norway (English)
- Österreich (Deutsch)
- Portugal (English)
- Sweden (English)
- Switzerland
- United Kingdom (English)