plotResponse
System object: phased.AngleDopplerResponse
Namespace: phased
Plot angle-Doppler response
Syntax
plotResponse(H,X)

plotResponse(H,X,ELANG)

plotResponse(H,X,PRF)

plotResponse(___,Name,Value)

hPlot = plotResponse(___)
Description
plotResponse( plots
the angle-Doppler response of the data in H,X)X in decibels. This syntax
is available when the ElevationAngleSource property is
'Property'.
The size of the first dimension of the input matrix can vary to simulate a changing signal length. A size change can occur, for example, in the case of a pulse waveform with variable pulse repetition frequency.
plotResponse(
plots the angle-Doppler response calculated using the specified elevation angle
H,X,ELANG)ELANG. This syntax is available when the ElevationAngleSource property is 'Input port'.
plotResponse(
plots the angle-Doppler response calculated using the specified pulse repetition
frequency H,X,PRF)PRF. This syntax is available when the PRFSource property is 'Input
port'.
plotResponse(___,
plots the angle-Doppler response with additional options specified by one or more
Name,Value)Name,Value pair arguments.
hPlot = plotResponse(___)
Input Arguments
| Angle-Doppler response object. |
| Input data. |
| Elevation angle in degrees. Default: Value of |
| Pulse repetition frequency specified as a positive scalar. To enable this
argument, set the |
Name-Value Arguments
Examples
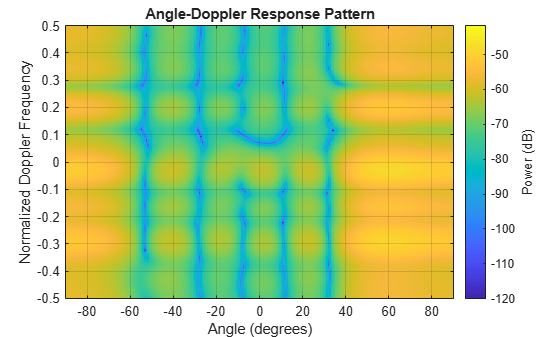
Plot the angle-Doppler response of the 190th cell of a collected data cube.
load STAPExampleData;
x = shiftdim(STAPEx_ReceivePulse(190,:,:));
hadresp = phased.AngleDopplerResponse(...
    'SensorArray',STAPEx_HArray,...
    'OperatingFrequency',STAPEx_OperatingFrequency,...
    'PropagationSpeed',STAPEx_PropagationSpeed,...
    'PRF',STAPEx_PRF);
plotResponse(hadresp,x,'NormalizeDoppler',true);