add
Add data to polar plot
Description
Examples
Add Data to Existing Polar Plot
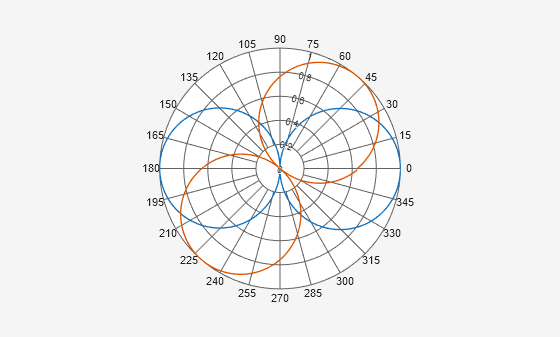
Create a cosine-pattern antenna and plot the pattern from 0° to 36°.
az = [0:360]; p1 = abs(cosd(az));
Plot the polar pattern.
P = polarpattern(p1);
Create a second cosine-pattern antenna rotated by 60°. Add this pattern to the existing pattern.
p2 = abs(cosd(az - 50)); add(P,p2);
Add Second Plot to Polar Pattern
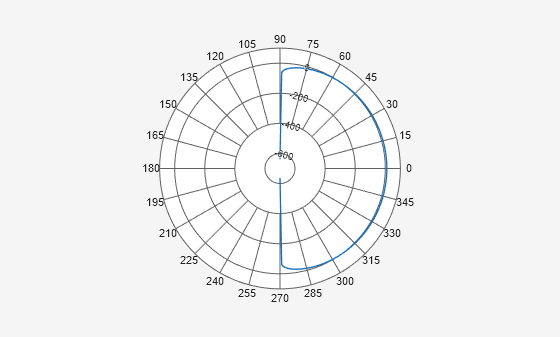
Create a cosine antenna and plot the polar pattern of its directivity at 75 MHz.
cosineantenna = phased.CosineAntennaElement('FrequencyRange',[1.0e0 100.0e9],... 'CosinePower',[2,2]); p1 = pattern(cosineantenna,75.0e6,[-90:90],0,'Type','Directivity'); P = polarpattern([-90:90],p1);
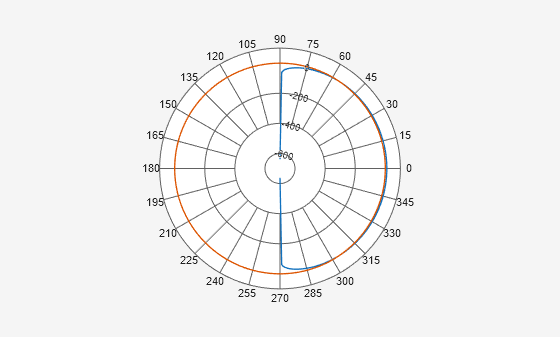
Create an isotropic antenna. Calculate the directivity of this antenna at 75 MHz.
isoantenna = phased.IsotropicAntennaElement('FrequencyRange',... [1.0e0 100.0e9]); p2 = pattern(isoantenna,75.0e6,[-180:180],0,'Type','Directivity');
Add the directivity plot of the isotropic antenna to the directivity plot of the cosine antenna.
add(P,[-180:180],p2);
Input Arguments
p
— Polar plot
scalar handle
Polar plot, specified as a scalar handle.
Example: polarpattern
data
— Antenna or array data
real length-M vector | real M-by-N matrix | real N-D array | complex vector or matrix
Antenna or array data, specified as one of the following:
A real length-M vector, where M contains the magnitude values with angles assumed to be degrees.
A real M-by-N matrix, where M contains the magnitude values and N contains the independent data sets. Each column in the matrix has angles taken from the vector degrees. The set of each angle can vary for each column.
A real N-D array, where N is the number of dimensions. Arrays with dimensions
2
and greater are independent data sets.A complex vector or matrix, where
data
contains Cartesian coordinates ((x,y) of each point. x contains the real part ofdata
and y contains the imaginary part ofdata
.
When data is in a logarithmic form such as dB, magnitude values
can be negative. In this case,polarpattern
plots
the lowest magnitude values at the origin of the polar plot and highest
magnitude values at the maximum radius.
Example: pattern(dipole,70e6)
angle
— Set of angles
vector in degrees
Set of angles, specified as a vector in degrees.
magnitude
— Set of magnitude values
vector | matrix
Set of magnitude values, specified as a vector or a matrix. For a matrix of magnitude values, each column is an independent set of magnitude values and corresponds to the same set of angles.
Version History
Introduced in R2016a
See Also
addCursor
| animate
| createLabels
| findLobes
| replace
| showPeaksTable
| showSpan
MATLAB Command
You clicked a link that corresponds to this MATLAB command:
Run the command by entering it in the MATLAB Command Window. Web browsers do not support MATLAB commands.
Select a Web Site
Choose a web site to get translated content where available and see local events and offers. Based on your location, we recommend that you select: United States.
You can also select a web site from the following list
How to Get Best Site Performance
Select the China site (in Chinese or English) for best site performance. Other MathWorks country sites are not optimized for visits from your location.
Americas
- América Latina (Español)
- Canada (English)
- United States (English)
Europe
- Belgium (English)
- Denmark (English)
- Deutschland (Deutsch)
- España (Español)
- Finland (English)
- France (Français)
- Ireland (English)
- Italia (Italiano)
- Luxembourg (English)
- Netherlands (English)
- Norway (English)
- Österreich (Deutsch)
- Portugal (English)
- Sweden (English)
- Switzerland
- United Kingdom (English)
Asia Pacific
- Australia (English)
- India (English)
- New Zealand (English)
- 中国
- 日本Japanese (日本語)
- 한국Korean (한국어)