plot
R2026bPlot cuboid model
Description
plot(
specifies options using one or more name-value arguments in addition to argument from the
previous syntax. For example, model,Name=Value)plot(model,Color="red") sets the color of
the plotted cuboid to red.
Examples
Detect a cuboid in a point cloud using pcfitcuboid function. The function stores the cuboid parameters as a cuboidModel object.
Read point cloud data into the workspace.
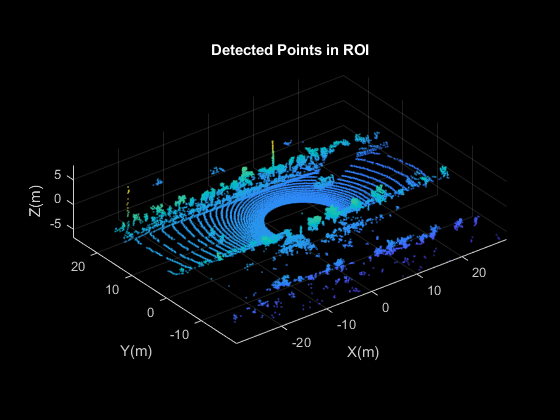
ptCloud = pcread('highwayScene.pcd');Search the point cloud within a specified region of interest (ROI). Create a point cloud of only the detected points.
roi = [-30 30 -20 30 -8 13];
in = findPointsInROI(ptCloud,roi);
ptCloudIn = select(ptCloud,in);
Plot the point cloud of detected points.
   figure
   pcshow(ptCloudIn.Location)
   xlabel('X(m)')
   ylabel('Y(m)')
   zlabel('Z(m)')
   title('Detected Points in ROI')
Find the indices of the points in a specified ROI within the point cloud.
roi = [9.6 13.8 7.9 9.3 -2.5 3];
sampleIndices = findPointsInROI(ptCloudIn,roi);
Fit a cuboid to the selected set of points in the point cloud.
 model = pcfitcuboid(ptCloudIn,sampleIndices);
  figure
  pcshow(ptCloudIn.Location)
  xlabel('X(m)')
  ylabel('Y(m)')
  zlabel('Z(m)')
  title('Detect a Cuboid in a Point Cloud')
Plot the cuboid box in the point cloud.
hold on
plot(model)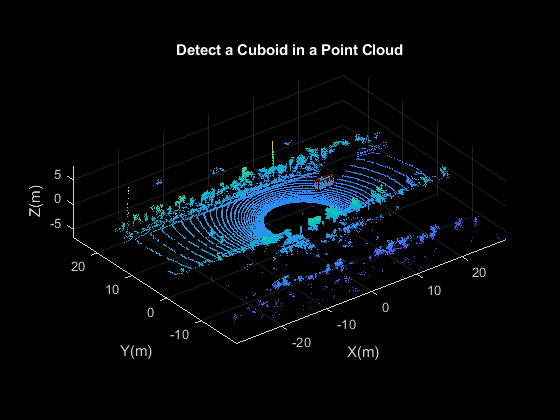
Display the internal properties of the cuboidModel object.
model
model =
  cuboidModel with properties:

     Parameters: [11.4873 8.5997 -1.6138 3.6713 1.3220 1.7576 0 0 0.9999]
         Center: [11.4873 8.5997 -1.6138]
     Dimensions: [3.6713 1.3220 1.7576]
    Orientation: [0 0 0.9999]
Input Arguments
Name-Value Arguments
Specify optional pairs of arguments as
Name1=Value1,...,NameN=ValueN, where Name is
the argument name and Value is the corresponding value.
Name-value arguments must appear after other arguments, but the order of the
pairs does not matter.
Example:
plot(model,Parent=gca) sets the output axes to the current axes in the
current figure.
Output axes, specified as an Axes object, on which to display the
cuboid model. For a list of properties, see Axes Properties.
Color of the cuboid, specified as an RGB triplet or a short or long color name.
| Color Name | Short Name | RGB Triplet | Appearance |
|---|---|---|---|
"red" | "r" | [1 0 0] |
|
"green" | "g" | [0 1 0] |
|
"blue" | "b" | [0 0 1] |
|
"cyan"
| "c" | [0 1 1] |
|
"magenta" | "m" | [1 0 1] |
|
"yellow" | "y" | [1 1 0] |
|
"black" | "k" | [0 0 0] |
|
"white" | "w" | [1 1 1] |
|









