encode
Syntax
Description
encodedValues = encode(bpsObj,environment)bpsEncoder object.
[
additionally returns the nearest object point for each basis point. The object points are
points that are located on the occupied areas in the input map environment.encodedValues,nearestPoints] = encode(bpsObj,environment)
Examples
Load an example map into the workspace, and use it to create an occupancy map with a resolution of 10 cells/meter.
load("exampleMaps.mat","simpleMap");
map = occupancyMap(simpleMap,10);
Specify the basis point set arrangement for encoding as "rectangular-grid".
arrangement = "rectangular-grid";Specify the encoding size as [10 10]. Therefore, the number of basis points returned for encoding the map environment will be 100.
encodingSize = [10 10];
Specify the dimensions of the rectangular grid. For correct results, the dimensions of the rectangular grid must be approximately same as that of the input environment.
xLims = map.XLocalLimits;
yLims = map.YLocalLimits;
dims = [(xLims(2) - xLims(1)) (yLims(2) - yLims(1))];
Specify the center of the map as the center of the rectangular grid.
center = [sum(xLims)/2 sum(yLims)/2];
Create a basis point set encoder using bpsEncoder object. This object computes the basis points and stores them in the Points property.
bpsObj= bpsEncoder(arrangement,encodingSize,Center=center,Dimensions=dims);
basisPoints = bpsObj.Points;
Encode the input 2D map environment by using the encode function.
[encodedValues,nearestPoint] = encode(bpsObj,map);
Display the map and the basis points along with its nearest object points.
show(map)
hold on
scatter(basisPoints(:,1),basisPoints(:,2),"filled",DisplayName="Basis Points")
quiver(basisPoints(:,1),basisPoints(:,2),nearestPoint(:,1)-basisPoints(:,1),...
       nearestPoint(:,2)-basisPoints(:,2),0,Color='black',DisplayName='Nearest points')
legend(Location="bestoutside")
![Figure contains an axes object. The axes object with title Occupancy Grid, xlabel X [meters], ylabel Y [meters] contains 3 objects of type image, scatter, quiver. These objects represent Basis Points, Nearest points.](../../examples/nav_robotics/win64/Encode2DMapEnvironmentUsingBasisPointSetsExample_01.png)
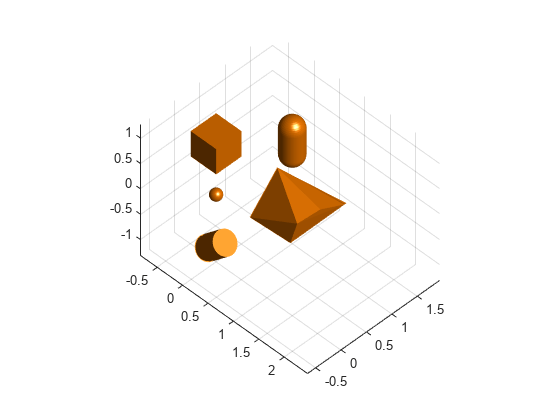
Create a 3-D environment with obstacles by using collision geometry objects such as collisionBox.
center = [0 0 0];
sph1 = collisionSphere(.1);
loc1 = [0 0 0] + center;
sph1.Pose = se3([0 0 0],"eul","XYZ",loc1);

mesh1 = collisionMesh(rand(10,3));
loc2 = [1 0 0] + center;
mesh1.Pose = se3([pi/4 0 0],"eul","XYZ",loc2);

box1 = collisionBox(.5,.5,.5);
loc3 = [0 0 1] + center;
box1.Pose = se3([0 0 0],"eul","XYZ",loc3);

cylinder1 = collisionCylinder(.2,.5);
loc4 = [0 0 -1] + center;
cylinder1.Pose = se3([0 pi/4 0],"eul","XYZ",loc4);

capsule1 = collisionCapsule(.2,.5);
loc5 = [0 1.5 0] + center;
capsule1.Pose = se3([0 0 pi/2],"eul","XYZ",loc5);

simpleGeom = {sph1,mesh1,box1,cylinder1,capsule1};
Plot the 3-D environment.
figure
light;
grid on;
axis("equal");
view(45,45);
hold on;
for i=1:length(simpleGeom)
    show(simpleGeom{i});
end

Convert the collision geometry objects to a geometry mesh structure.
meshArray = geom2struct(simpleGeom);
Compute truncated signed distance field (TSDF) map to get voxel-based representation of the 3D environment.
meshTSDFObj = meshtsdf(meshArray,FillInterior=true,Resolution=20)
meshTSDFObj =
  meshtsdf with properties:

                MeshID: [5×1 double]
               NumMesh: 5
             MapLimits: [2×3 double]
        NumActiveVoxel: 14997
            Resolution: 20
    TruncationDistance: 0.1500
          FillInterior: 1
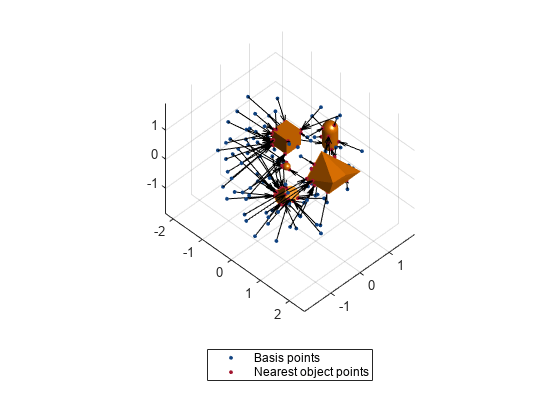
Encode the TSDF map using the basis point set approach.
arrangement = "uniform-ball-3d";
encodingSize = 100;
bpsObj= bpsEncoder(arrangement,encodingSize,Center=[0 0 0],Radius=2);
basisPoints = bpsObj.Points;
[encoding, nearestPts] = encode(bpsObj,meshTSDFObj);
Display the basis points and the nearest object points that represent the obstacles in the environment.
plot3(basisPoints(:,1),basisPoints(:,2),basisPoints(:,3),plannerLineSpec.state{:});

nearestSpec = plannerLineSpec.state(Color='#A2142F',MarkerFaceColor='#A2142F',MarkerEdgeColor='#A2142F');
plot3(nearestPts(:,1),nearestPts(:,2),nearestPts(:,3),nearestSpec{:});

quiver3(basisPoints(:,1),basisPoints(:,2),basisPoints(:,3),...
nearestPts(:,1)-basisPoints(:,1),nearestPts(:,2)-basisPoints(:,2),nearestPts(:,3)-basisPoints(:,3),0,Color='black');

legend('','','','','','Basis points','Nearest object points',Location="southoutside")
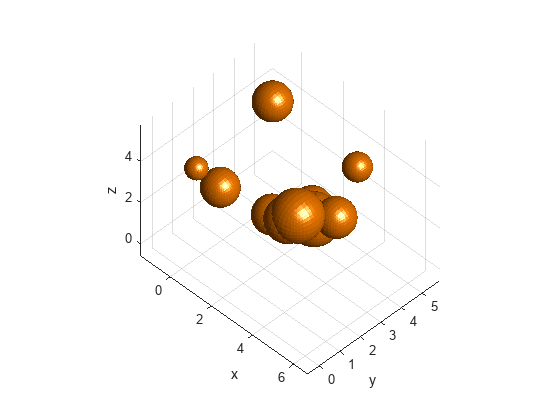
Create a random environment with spherical obstacles.
Specify the number of spherical obstacles to add as 10. Set the range for randomly computing the radius and position values of the spheres.
numSpheres = 10;
radRange = [.2 1];
posRange = [0 5];
collisionSpheres = cell(1,numSpheres);
spheres = zeros(4,numSpheres);
for i=1:numSpheres
    % Compute radius
    randomRad = (radRange(2)-radRange(1))*rand(1) + radRange(1);
    % Compute position
    randomPos = arrayfun(@(~)(posRange(2)-posRange(1))*rand(1) + posRange(1),1:3);
    % Create random sphere
    sph = collisionSphere(randomRad);
    % Convert coordinates to homogeneous transformation matrix
    sph.Pose = trvec2tform(randomPos);
    % Obtain and store its 3D vertices
    collisionSpheres{i} = sph;
    % Store its radius and position values
    spheres(:,i) = [randomRad;randomPos'];
end
Display the environment containing spherical obstacles using a helper function.
figure
hold on;
helperDisplay(collisionSpheres);
xlabel("x")
ylabel("y")
zlabel("z")
hold off

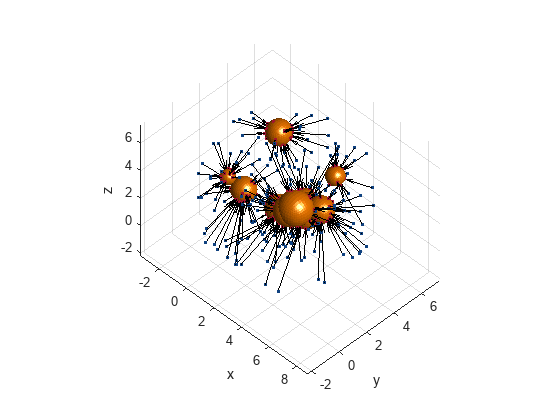
Create a basis point set encoder object for a "uniform-ball-3d" arrangement by specifying the encoding size, radius, and center.
bpsObj = bpsEncoder("uniform-ball-3d",200,Radius=5,Center=[2.5 2.5 2.5]);Encode the environment.
[encoding,nearestPoint] = encode(bpsObj,spheres);
Display results.
figure
hold on;
helperDisplay(collisionSpheres);

basis = bpsObj.Points;
plot3(basis(:,1), basis(:,2),basis(:,3), plannerLineSpec.state{:}, DisplayName='Basis Points')
nearestSpec = plannerLineSpec.state(Color='#A2142F', MarkerFaceColor='#A2142F', MarkerEdgeColor='#A2142F');
plot3(nearestPoint(:,1), nearestPoint(:,2), nearestPoint(:,3), nearestSpec{:}, DisplayName="nearest obstacles");

quiver3(basis(:,1), basis(:,2),basis(:,3), nearestPoint(:,1)-basis(:,1), ...
   nearestPoint(:,2)-basis(:,2), nearestPoint(:,3)-basis(:,3),0, Color='black')

xlabel("x")
ylabel("y")
zlabel("z")
hold off

Helper function to display the environment
function helperDisplay(collisionSpheres)
light;
grid on;
axis("equal");
view(45,45);
hold on;
numSpheres = width(collisionSpheres);
for i=1:numSpheres
    % Show mesh
    show(collisionSpheres{i})
end
end
Input Arguments
Basis point set encoder, specified as a bpsEncoder object.
Input environment to be encoded, specified as a occupancyMap (Navigation Toolbox), binaryOccupancyMap (Navigation Toolbox), meshtsdf (Navigation Toolbox) object,
or a 4-by-M matrix representing spherical obstacles in a 3-D
environment. Each column in the matrix is of the form [r;
x; y; z].
r is the radius of the sphere and [x
y
z] denote the center of the sphere. M is the
number of spherical obstacles in the input environment.
Output Arguments
Distance from each basis point to its nearest object point, returned as a N-by-1 vector.
N is the number of basis points. This value is determined by the
EncodingSize property of the BPS encoder object. The distance
values provide a compact representation of the input map environment for motion planning
with deep learning approaches such as the motion planning networks (MPNet) and
deep-learning-based Covariant Hamiltonian Optimization for Motion Planning
(CHOMP).
For information about MPNet, see Get Started with Motion Planning Networks (Navigation Toolbox). For information about
deep-learning-based CHOMP, see dlCHOMP.
Data Types: double
Nearest object points of each basis point, returned as a N-by-1 vector. Nearest object points are the points on the occupied areas (obstacles) in the input environment.
Data Types: double
Extended Capabilities
C/C++ Code Generation
Generate C and C++ code using MATLAB® Coder™.
Version History
Introduced in R2024a
See Also
bpsEncoder | mpnetSE2 (Navigation Toolbox) | mpnetPrepareData (Navigation Toolbox) | dlCHOMP
MATLAB Command
You clicked a link that corresponds to this MATLAB command:
Run the command by entering it in the MATLAB Command Window. Web browsers do not support MATLAB commands.
Seleziona un sito web
Seleziona un sito web per visualizzare contenuto tradotto dove disponibile e vedere eventi e offerte locali. In base alla tua area geografica, ti consigliamo di selezionare: .
Puoi anche selezionare un sito web dal seguente elenco:
Come ottenere le migliori prestazioni del sito
Per ottenere le migliori prestazioni del sito, seleziona il sito cinese (in cinese o in inglese). I siti MathWorks per gli altri paesi non sono ottimizzati per essere visitati dalla tua area geografica.
Americhe
- América Latina (Español)
- Canada (English)
- United States (English)
Europa
- Belgium (English)
- Denmark (English)
- Deutschland (Deutsch)
- España (Español)
- Finland (English)
- France (Français)
- Ireland (English)
- Italia (Italiano)
- Luxembourg (English)
- Netherlands (English)
- Norway (English)
- Österreich (Deutsch)
- Portugal (English)
- Sweden (English)
- Switzerland
- United Kingdom (English)