traversabilityMap
Create traversability map using elevation data and semantic cost of terrain
Since R2025a
Description
Add-On Required: This feature requires the Robotics System Toolbox Offroad Autonomy Library add-on.
The traversabilityMap object creates a traversability map using
elevation data and semantic cost data of an uneven terrain. The traversability is a
combination of geometric traversability, computed using elevation data, and semantic
traversability, which you specify as semantic cost. You can specify thresholds and relative
cost weights for these properties and visualize the resulting traversability map using the
show
function.
The traversability map estimates the navigability of an offroad terrain by calculating traversability costs based on elevation model of the terrain at specific grid locations using point cloud data.
Creation
Syntax
Description
map = traversabilityMap
map = traversabilityMap( creates a
elevmodel)traversabilityMap object from a 2-D matrix,
elevmodel, containing the elevation of a terrain with default
resolution of 1 cell per meter. The first dimension of elevmodel
matrix corresponds to the y-axis and second dimension to the x-axis.
map = traversabilityMap(
creates a elevmodel,res)traversabilityMap object from a 2-D matrix,
elevmodel, containing the digital elevation model for a terrain
with the Resolution
property, specified as cells per meter.
map = traversabilityMap(
creates a elevmodel,semanticCost,res)traversabilityMap object from a 2-D matrix,
elevmodel, containing the digital elevation model for a terrain
with the SemanticThreshold and Resolution
properties, specified as cells per meter.
map = traversabilityMap( creates a
mapData)traversabilityMap object from mapData, which is a
cell array of two 2-D matrices of equal size, containing elevation data and semantic
cost.
map = traversabilityMap(
creates a mapData,res)traversabilityMap object from mapData,
which is a cell array of two 2-D matrices of equal size, containing elevation data and
semantic cost, with the Resolution
property, specified as cells per meter.
map = traversabilityMap(___,Name=Value) specifies
properties using one or more name-value arguments.
Input Arguments
Properties
Object Functions
copy | Create copy of traversability map |
cost | Retrieve data from traversability map layer |
setMapData | Assign data to traversability map layer |
show | Display terrain traversability map layer |
Examples
Create traversability map with a sample digital elevation model (DEM) and set the map resolution.
The resolution sets the size of each grid cell in meters. A smaller value of resolution gives finer details.
resolution = 1.25; % cells per meter
[xdata, ydata] = meshgrid(0:resolution:100, flip(0:resolution:100)); % x and y axes data of the terrain
elevationModel = peaks(size(xdata,1)); % Terrain elevation in meters
elevationModel(elevationModel<0) = 0; % Discard valleys
Visualize digital elevation model (DEM) of the terrain.
figure;
surf(xdata, ydata, elevationModel, EdgeColor="none");
xlabel('X [m]')
ylabel('Y [m]')
zlabel('Elevation [m]')
view(2)
colorbar
Create traversability map from the digital elevation model (DEM).
map = traversabilityMap(elevationModel, resolution)
map =
  traversabilityMap with properties:

          SlopeThreshold: [0.2000 0.3000]
      RoughnessThreshold: [0.1000 0.2000]
     StepHeightThreshold: [1.1352 1.7323]
    StepHeightWindowSize: 5.6000
              CostWeight: [1 1 1]
       GridOriginInLocal: [0 0]
              Resolution: 1.2500
            XLocalLimits: [0 64.8000]
            YLocalLimits: [0 64.8000]
Display the traversability map.
show(map, "local")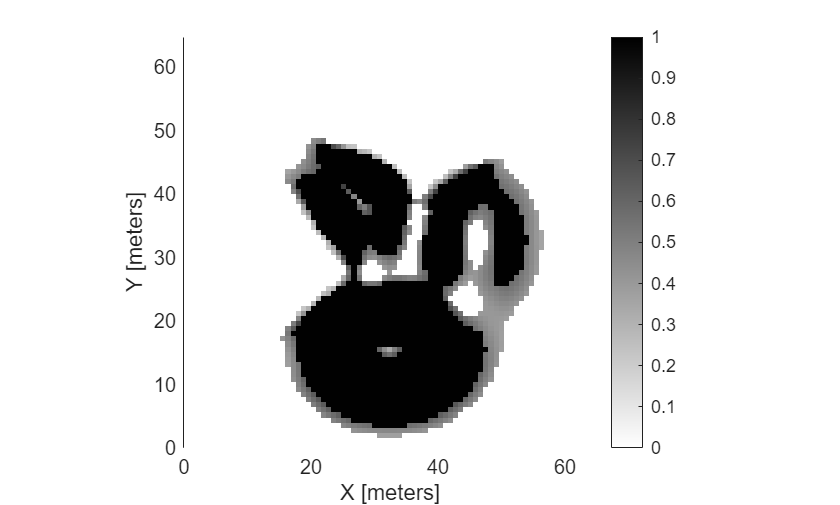
Enable SlopeThreshold and set the safe and critical values.
Flexible threshold values allow intermediate terrains with moderate slopes (for example, between 10° and 15°) to have a cost but remain traversable. In this case, areas with slope ≤ 10° are considered safe whereas areas with slope > 15° are non-traversable. Areas between the safe and critical thresholds are assigned intermediate cost values.
safeSlope = 10 * pi / 180;
criticalSlope = 15 * pi / 180;
map.SlopeThreshold = [safeSlope, criticalSlope];
Set the StepHeightThreshold and RoughnessThreshold to infinity to disable their influence.
map.StepHeightThreshold = inf; % No limit on step height
map.RoughnessThreshold = inf; % No limit on roughness
Display the updated traversability map in the local coordinate frame.
show(map, "local")
Define a window using the x- and y-axis coordinates, its bottom-left corner and its width and height. Extract the data for that window.
mapData = getMapData(map, [20,30], [5,7]);
disp("Traversability Map Data:");
Traversability Map Data:
disp(mapData);
    0.8802    1.0000    1.0000    1.0000    1.0000    1.0000    1.0000
         0    1.0000    1.0000    1.0000    1.0000    1.0000    1.0000
         0         0    1.0000    1.0000    1.0000    1.0000    1.0000
         0         0         0    1.0000    1.0000    1.0000    1.0000
         0         0         0    0.7495    1.0000    1.0000    1.0000
         0         0         0         0    1.0000    1.0000    1.0000
         0         0         0         0         0    1.0000    1.0000
         0         0         0         0         0    0.8712    1.0000
         0         0         0         0         0         0    1.0000
To configure strict slope threshold, set identical values for safe and critical threshold limits. This use case is applicable for offroad vehicles designed for flat terrains or with low tolerance for inclines.
strictSlope = 10 * pi / 180;
map.SlopeThreshold = [strictSlope, strictSlope];
Visualize the updated traversability map. You can access the traversability data by using getMapData.
show(map, "local")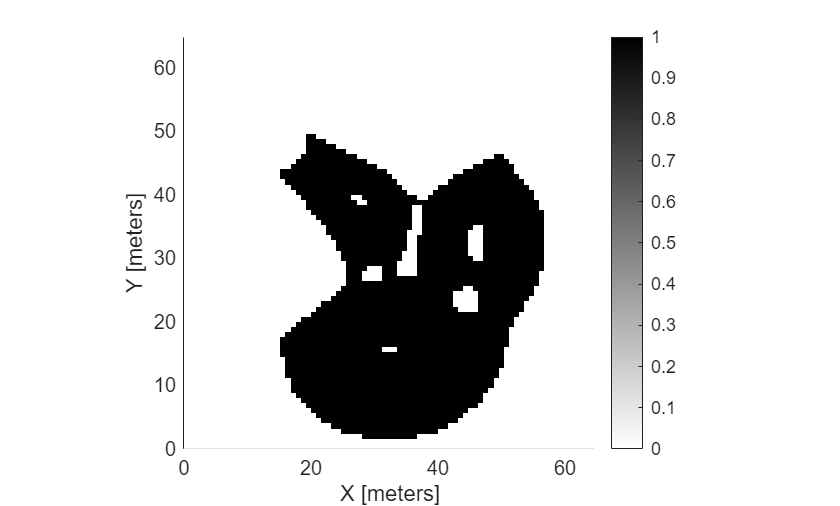
Create a sample digital elevation model and define the resolution of the map. The resolution determines the grid cell size in meters, balancing detail, and computation cost.
load("pitMineDEM.mat", "elevationModel", "resolution")
Create the traversability map object for terrain navigability analysis and visualization.
map = traversabilityMap(elevationModel, resolution);
Define thresholds for terrain properties such as slope, step height, and roughness.
In this case, areas with slope less than or equal to 10° are considered safe whereas areas with slope greater than 15° are non-traversable.
map.SlopeThreshold = [10, 15] * pi / 180; % in radiansAreas with a step height below 1 m are considered safe, while those above 2 m are considered critical, within a window size of 6 m. Assume this window size for step height computation to be equal to the length of the vehicle.
map.StepHeightThreshold = [1, 2]; % in metres
map.StepHeightWindowSize = 6; % in metres
Areas with roughness below 0.1 are considered safe and that above 0.3 are considered critical.
map.RoughnessThreshold = [0.1, 0.3]; % in metresAssign custom cost weights to these terrain properties. The cost weights assign a relative importance to each property in computing the overall traversability cost of terrain. The object normalizes these weights, meaning their sum ideally equals 1 for intuitive scaling.
For an offroad vehicle, set the cost weight of slope to 0.7 to prioritize avoiding steep slopes, step height to 0.2 assuming that the vehicle can handle moderate steps but should still avoid large ones, and roughness to 0.1 as an uneven terrain such as gravel, is less critical to the vehicle's ability to move.
map.CostWeight = [0.7, 0.2, 0.1];
Display the map with a colorbar to visualize the cost distribution.
figure;
ax = show(map, "grid");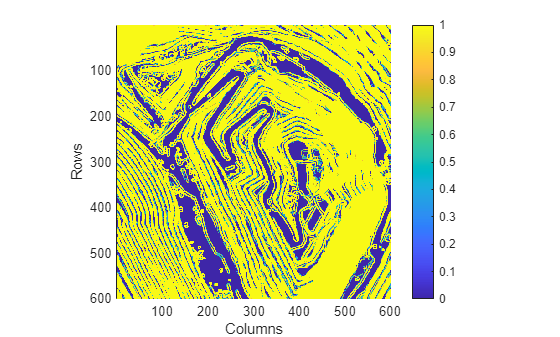
This example shows how to augment a geometric traversability map with semantic cost information derived from satellite imagery. You first compute a traversability map from a digital elevation model (DEM). You then fuse semantic segmentation data to penalize or promote specific terrain classes, resulting in a more realistic and task-aware traversability estimate.
Load the digital elevation model (DEM) of Manassas National Battlefield Park, Virginia, to visualize its height profile to understand the underlying geometry. The Zreal stores the elevation data and res specifies the grid resolution.
% Add helper folders to path
addpath("Data");

load("manassasData.mat", "Xreal", "Yreal" , "Zreal", "res");
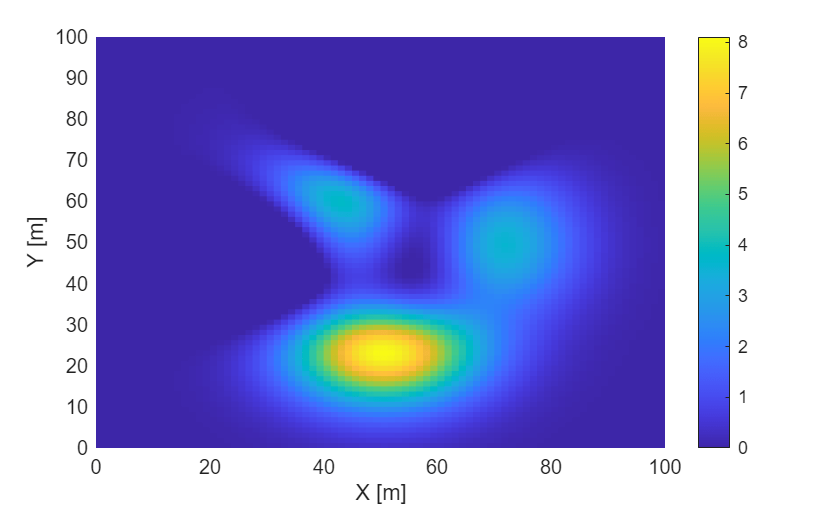
Visualize the digital elevation model (DEM) to inspect terrain features such as roads, elevation changes, and man-made structures.
figure
surf(Xreal, Yreal, Zreal, EdgeColor="none")
title("Digital Elevation Model")
xlabel('X [m]');
ylabel('Y [m]')
ylabel("Z [m]")
xlim([Xreal(1,1), Xreal(1,end)])
ylim([Yreal(1,1), Yreal(end,1)])
colorbar
view(2)
![Figure contains an axes object. The axes object with title Digital Elevation Model, xlabel X [m], ylabel Z [m] contains an object of type surface.](../../examples/offroad_autonomy/win64/EstimateTerrainTraversabilityWithSemanticCostInformationExample_01.png)
Create geometric traversability map for the terrain from the digital elevation model (DEM) by specifying the SlopeThreshold property and disabling the RoughnessThreshold and StepHeightThreshold properties. This configuration highlights large-scale geometric features of the terrain.
map = traversabilityMap(flipud(Zreal), res);
map.SlopeThreshold = [10, 15]*pi/180; % safe and critical slope thresholds in radians
map.RoughnessThreshold = inf;
map.StepHeightThreshold = inf;
Visualize resulting geometric traversability map.
figure
show(map)
title("Traversability Map (geometric)")![Figure contains an axes object. The axes object with title Traversability Map (geometric), xlabel X [meters], ylabel Y [meters] contains an object of type image.](../../examples/offroad_autonomy/win64/EstimateTerrainTraversabilityWithSemanticCostInformationExample_02.png)
The geometric traversability map captures features such as roads, open regions, and building boundaries based solely on terrain shape. However, geometry alone cannot distinguish between visually similar but semantically different regions, such as grass versus paved roads.
Now, load the satellite image corresponding to the same location and dimensions. This image provides visual cues for identifying terrain classes such as roads, vegetation, and buildings.
img = imread("visitorcenter_satellitesq.jpg");

figure;
image(img)
title("Satellite Image")

Load semantic segmentation masks generated for the satellite image. Each mask represents a specific semantic class, such as roads, trees, grass, or buildings. These masks were generated using the Get Started with the Image Labeler (Computer Vision Toolbox) app or can be produced using automated segmentation models.
load("visitorcenter_satellitesq_segmented.mat", "masks")
masks
masks =

  dictionary (string ⟼ cell) with 5 entries:

    "low_grass" ⟼ {1027×1027 double}
    "trees"     ⟼ {1027×1027 double}
    "building"  ⟼ {1027×1027 double}
    "road"      ⟼ {1027×1027 double}
    "soil"      ⟼ {1027×1027 double}
Assign semantic cost to each terrain class. Lower costs indicate preferred traversal regions, while higher costs represent obstacles or restricted areas.
For semantic classes such as roads, assign a cost of 0. For obstacles like trees, assign a cost of 1. And for classes such as grass or soil, assign a cost between 0 and 1.
Compute combined semantic cost map by weighting each semantic mask with its corresponding cost.
costRoad = 0;
costLowGrass = 0.3;
costSoil = 0.7;
costBuildings = 1;
costTrees = 1;

semanticCost = costRoad * cell2mat(masks("road"))  + costLowGrass  * cell2mat(masks("low_grass")) + costSoil * cell2mat(masks("soil")) + ...
               costTrees* cell2mat(masks("trees")) + costBuildings * cell2mat(masks("building"));
Resize semantic cost map to match the resolution of the elevation data.
semanticCost = resize(semanticCost, size(Zreal));
Integrate semantic cost map with the geometric traversability map. This step adjusts traversability scores based on semantic context.
setMapData(map, "Semantic", semanticCost)Integrate the semantic cost map with the geometric traversability map. This step adjusts traversability scores based on semantic context.
show(map)
title('Traversability map (geometric + semantic)')![Figure contains an axes object. The axes object with title Traversability map (geometric + semantic), xlabel X [meters], ylabel Y [meters] contains an object of type image.](../../examples/offroad_autonomy/win64/EstimateTerrainTraversabilityWithSemanticCostInformationExample_04.png)
References
[1] Chilian, Annett, and Heiko Hirschmuller. “Stereo Camera Based Navigation of Mobile Robots on Rough Terrain.” In 2009 IEEE/RSJ International Conference on Intelligent Robots and Systems, 4571–76. St. Louis, MO: IEEE, 2009. https://doi.org/10.1109/IROS.2009.5354535.
[2] Guan, Tianrui, Zhenpeng He, Ruitao Song, Dinesh Manocha, and Liangjun Zhang. “TNS: Terrain Traversability Mapping and Navigation System for Autonomous Excavators.” In Robotics: Science and Systems XVIII. Robotics: Science and Systems Foundation, 2022. https://doi.org/10.15607/RSS.2022.XVIII.049.