Create Zebra-Striped Tables in Reports
You can create zebra-striped or banded tables, which are tables that have alternating color rows or columns. You can create zebra-striped tables programmatically or by using a Microsoft® Word or HTML template.
Note
PDF templates do not support zebra-striped tables.
For more information, see Format Tables, Create Microsoft Word Templates, and Create HTML and PDF Templates.
Programmatically Create a Zebra-Striped Table
This example shows how to create a report that contains a table that spans multiple pages, has alternating row background colors, and a header row that appears on every page that contains the table.
Import the Document Object Model (DOM) and Report namespaces.
import mlreportgen.dom.*
import mlreportgen.report.*
Import the sample data set outages.csv as a table.
outages = readtable("outages.csv","TextType","string");
Create the report container.
rpt = Report("zebraRows","pdf");
Open the report and create a chapter.
open(rpt);
chapter = Chapter;
Create a formal table and a table row.
table = FormalTable;
header = TableRow;
Add entries to table that contain the variable names from the outages table.
for colNumber = 1:width(outages)
append(header,TableEntry(outages.Properties.VariableNames{colNumber}));
end
Set the background color of the table row to salmon and append the row to the formal table as the header row.
header.Style = {BackgroundColor("salmon")};
appendHeaderRow(table,header);
For the first 60 rows in the outages table, create a table row, set the row background color, add table entries for each column, and append the row to the formal table.
colors = ["white" "cadetblue"];
for rowNumber = 1:60
    row = TableRow;
    row.Style = {BackgroundColor(colors(~mod(rowNumber, 2)+1))};
    for colNumber = 1:width(outages)
        entry = Text(outages{rowNumber,colNumber});
        append(row,TableEntry(entry));
    end
    append(table, row);
end
Define the table style. Add a border and separators for the rows and columns. Set the text to use 16pt bold and italic font.
table.Style = {Border("dashed"),ResizeToFitContents(true), ...
    RowSep("solid"),ColSep("solid"),FontSize("16pt"),Bold,Italic};
Create a BaseTable reporter.
baseTable = BaseTable(table);
Add the baseTable reporter to the chapter, and add the chapter to the report.
append(chapter,baseTable);
append(rpt,chapter);
Close and view the report.
close(rpt);
rptview(rpt);
Create a Zebra-Striped Table by Using a Microsoft® Word Template
You can create a zebra-striped table by adding a table style to a Microsoft Word template. Then, you can use the template to generate a report with a zebra-striped table. Using a template organizes your application into separate components.
1. Create a Word template named myrpt.dotx.
mlreportgen.report.Report.createTemplate("myrpt","docx");
2. Right-click the template file and, in the context menu, click Open Outside MATLAB. If you double-click the file name, it opens as a DOC file that uses the template.
3. Open the Styles pane.
4. In the Styles pane, click the New Style button.
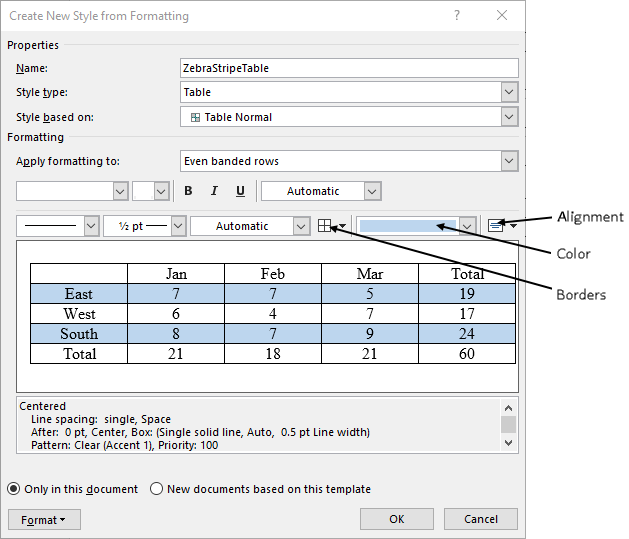
5. To define a table style that you can use to create zebra-stripe rows, set these fields:
Name —
ZebraStripeTableStyle type —
Table
5. Set Apply formatting to to Even banded rows. In the color field, select a color for the odd banded rows from the drop-down list.
6. Set Apply formatting to to Whole table and set these fields:
Alignment —
Align CenterBorders —
All Borders
6. Click OK to save the new style.
7. Save the template file.
8. To avoid having to use fully qualified class names, import the Report and DOM namespaces.
import mlreportgen.report.*
import mlreportgen.dom.*
9. Create the report container and specify the myrpt template.
rpt = mlreportgen.report.Report("myreport","docx","myrpt.dotx");
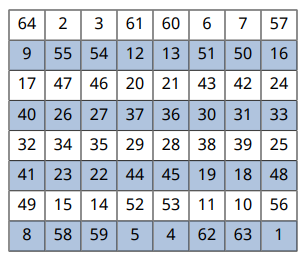
10. Create a magic square table and set the table style.
maglen = 8;
mag = magic(maglen);
table = Table(mag);
table.StyleName = "ZebraStripeTable";
11. Specify the row height and table width.
table.Style={RowHeight("0.3in")};
table.Width= "3in";
12. Add the table to the report. Then, close and view the report.
append(rpt,table);
close(rpt);
rptview(rpt);
Create a Zebra-Striped Table by Using an HTML Template
You can create a zebra-striped table by adding a table style to an HTML template.
1. Create an HTML template.
mlreportgen.report.Report.createTemplate("myrpt","html");
2. Unzip the template into a folder named myrpt. The folder contains style sheets and image template files.
unzipTemplate("myrpt.htmtx");3. In the myrpt folder, in the stylesheets folder, open the root.css file.
4. To create a CSS rule that defines the style name ZebraStripeTable for an HTML table element, add these lines to the root.css file. The background colors #B0C4DE and #FFFFFF are light blue and white, respectively,
/* Settings for whole table */
table.ZebraStripeTable {
text-align: center;
border: 1px solid black;
border-collapse: collapse;
width: 5in;
height: 4in;
}
/* Settings for table body */
table.ZebraStripeTable td {
padding: 0pt 0pt 0pt 0pt;
vertical-align: middle;
text-align: center;
border: 1px solid black;
border-collapse: collapse;
}
/* Zebra rows and colors */
tr:nth-child(even) {
background-color: #B0C4DE
}
tr:nth-child(odd) {
background-color: #FFFFFF
}
5. Save the root.css file.
6. Zip the template files to the mrpt.htmtx template package.
zipTemplate("myrpt");7. Import the Report and DOM namespaces to avoid having to use fully qualified class names.
import mlreportgen.report.*
import mlreportgen.dom.*
8. Create a report by using the template.
rpt = mlreportgen.report.Report("myreport","html","myrpt.htmtx");
9. Create a magic square table and set the StyleName property to the table style.
maglen = 8;
mag = magic(maglen);
tb = Table(mag);
tb.StyleName = "ZebraStripeTable";
10. Add the table to the report. Then, close and view the report.
append(rpt,tb);
close(rpt);
rptview(rpt);
See Also
mlreportgen.dom.FormalTable | mlreportgen.dom.Table | unzipTemplate | zipTemplate | mlreportgen.report.Report | rptview