Use Report Explorer to Create Simulink Reports
This example shows how to use the Report Explorer to design a report setup file and generate a report that:
Opens the Simulink® model
vdp, which models the van der Pol equation.Sets the Gain parameter for the Mu block to five different values.
Simulates the model for each value of the Gain parameter.
Reports on the results that fall within a specified range.
Create Report Setup File
To set up a report, you create a setup file and add components, which are MATLAB® objects that describe the contents of the report. For instance, the completed report in this example uses components to create a title page, chapters, text, and snapshots of the vdp model.
Tip: To open the completed report setup file for this example, in the MATLAB Command Window, enter:
setedit simulink-dynamic.rpt
To create and configure the report setup file:
1. Open the Report Explorer. From the MATLAB or Simulink Toolstrip, in the Apps tab, in the Simulation Graphics and Reporting section, click Report Generator.
2. Select File > New to create a report setup file.
3. In the right pane of the Report Explorer, set these properties for the report:
To save the report in the current working folder, set Directory to
Present working directory.To generate the report output as HTML, set File format to
HTML (from template).In the Report description box, enter this text:
Simulink Dynamic Report

This report tests the model vdp by setting a block
parameter several times, simulating the model, and
collecting the results. At the end of the report, a
table displays the simulation results that fall in a
specified range.

In the first "Eval" component in the report setup file,
you can modify:
* the model
* the block
* the parameter
* the parameter values to test
* the expected range of simulation results
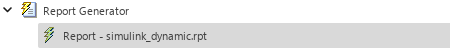
4. To save your report, select File > Save As and name your report setup file simulink_dynamic.rpt. In the left pane, the new file name appears under Report Generator.
Specify Report Variables and Open Model
To specify the model, the block, and the block parameter that the appear in the report, use an Evaluate MATLAB Expression component that creates these variables in the MATLAB workspace and opens the model:
expModelspecifies the name of the model.expBlockspecifies the name of the block.expParamspecifies the name of the block parameter.expValuespecifies the parameter values to use for experimentation.testMinandtestMaxspecify the desired range of values for the output signal from the simulation.
To add the component to the setup file:
1. In the left pane of the Report Explorer, select the report setup file.
2. In the middle pane, in the MATLAB section, select Evaluate MATLAB Expression.
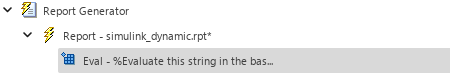
3. In the right pane, click Add component to current report. The left pane shows the new component under the simulink_dynamic report by using the abbreviation Eval.
4. In the right pane, specify these properties for the Eval component:
To exclude the MATLAB code details and output from the report, clear the Insert MATLAB expression in report and Display command window output in report check boxes.
To define the report variables and open the model, in the Expression to evaluate in the base workspace box, enter this MATLAB code:
% The name of the model
expModel="vdp";

% The name of the block
expBlock="vdp/Mu";

% The name of the block parameter
% to change
expParam="Gain";

% The parameter values to use
% during experimentation.
expValue=[-1 0 .5 1 2];

% expValue can be either a vector
% or a cell array

testMin=2;
testMax=3;

%---- do not change code below line ---

try
   open_system(expModel);
end

expOkValues=cell(0,2);
To display an error if the commands from the previous step fail, in the Evaluate this expression if there is an error box,enter this code:
disp("Error during eval:"+evalException.message)
5. To test your MATLAB commands, click Eval Now.
Create Title Page
To create a title page for the report, use a Title Page component:
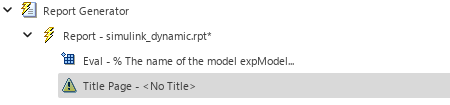
1. In the left pane, select the Eval component.
2. In the middle pane, in the Formatting section, select the Title Page component. Then, in the right pane, click Add component to current report.
In the left pane, the icon ![]() indicates that the Eval component cannot have child components, so the Title Page component is a sibling of the Eval component.
indicates that the Eval component cannot have child components, so the Title Page component is a sibling of the Eval component.
3. In the right pane, in the Main tab, specify these properties for the Title Page component:
Set Title to
Dynamic Simulink Report.Set Subtitle to
Document Changes in Output of van der Pol Equation.Under Options, select
Custom author. Then, in the box to the right, enter your name.Clear the Include report creation date checkbox.
Verify That Model Is Open
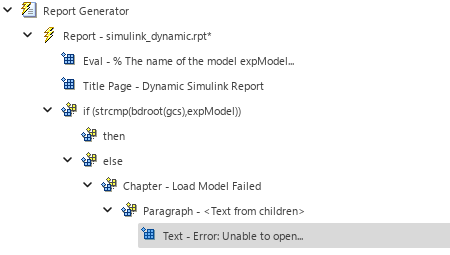
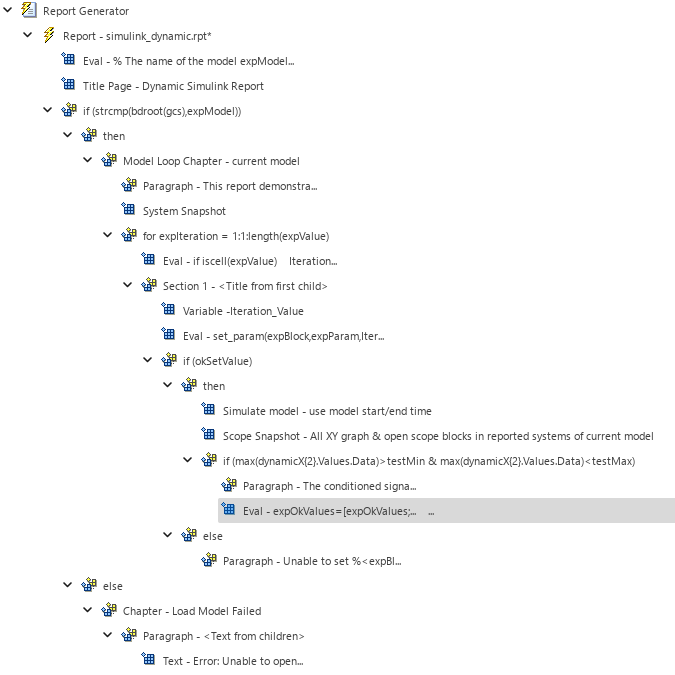
To check that open_system command in the Eval component successfully opened the model, add Logical If, Logical Then, and Logical Else components. If the model fails to open, display an error message in the report by using a Chapter/Subsection, a Paragraph, and a Text component:
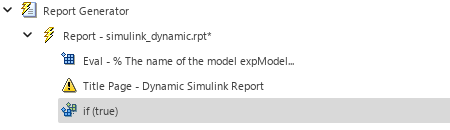
1. In the left pane, select the Title Page component.
2. In the middle pane, in the Logical and Flow Control section, select the Logical If component. Then, in the right pane, click Add component to current report. The left pane displays the Eval, Title Page, and if components as siblings of one another.
3. In the right pane, set Test Expression to
strcmp(bdroot(gcs),expModel)
The strcmp function compares the name of the open Simulink model and the value of expModel to test whether the model opened successfully.
4. In the middle pane, in the Logical and Flow Control section, add a Logical Then component.
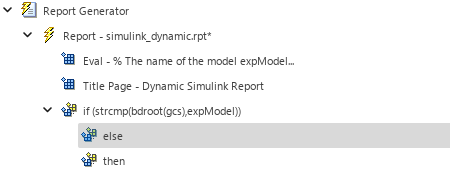
5. In the left pane, select the if component again. Then, in the middle pane, in the Logical and Flow Control section, add a Logical Else component.
In the left pane, the icon ![]() indicates that the if component can have child components, so the else and then components are children of the if component, with the else component appearing above the then component.
indicates that the if component can have child components, so the else and then components are children of the if component, with the else component appearing above the then component.
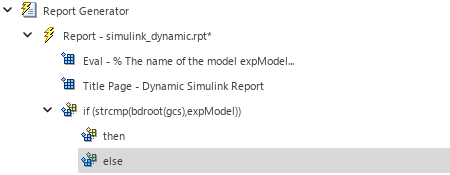
6. On the toolbar, use the Move Down button ![]() to move the else component under the then component.
to move the else component under the then component.
7. In the middle pane, in the Formatting section, add a Chapter/Subsection component.
8. In the right pane, for Title, select Custom. Then, in the box to the right, enter Load Model Failed.
9. In the middle pane, in the Formatting section, add a Paragraph component and a Text component.
10. In the left pane, select the Text component. Then, in the right pane, specify these properties:
In the Text to include in report box, enter:
Error: Unable to open model %<expModel>.
Under Style, select Italic.
The delimiters %< and > evaluate MATLAB code and insert the result into the report. In this case, the code returns the value of the workspace variable expModel, which is the name of the model.
The left pane shows the Chapter component as a child of the else component, the Paragraph component as a child of the Chapter component, and the Text component as a child of the Paragraph component.
Insert Image of Model
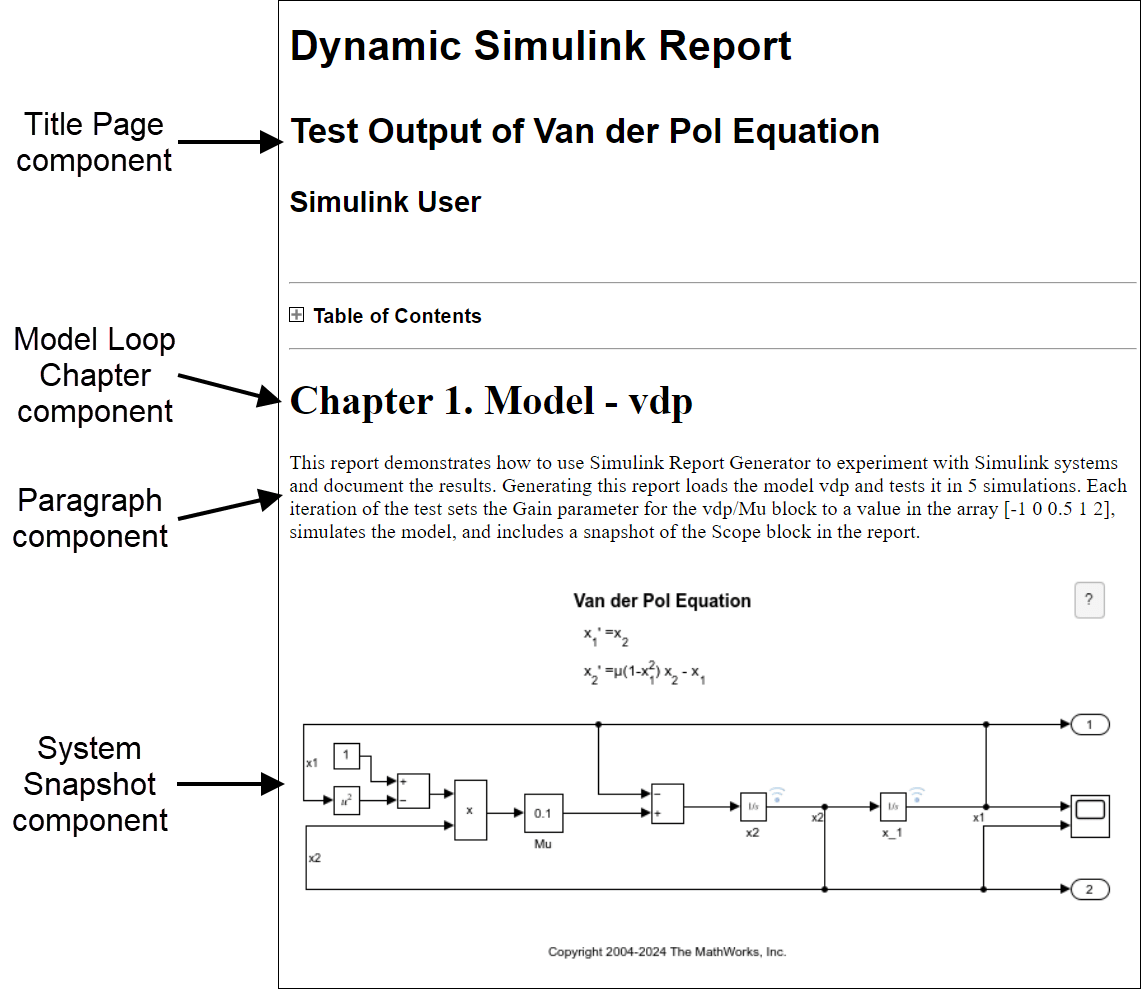
To insert an image of the model into the report, add a Model Loop component that contains a System Snapshot component. Then add a Paragraph component to explain the purpose of the report:
1. In the left pane, select the then component.
2. In the middle pane, in the Simulink section, add a Model Loop component. Then, in the right pane, specify these properties:
Under Model Options, select the Active check box.
Set Traverse model to
Selected system(s) only.Set Starting system(s) to
$top.Under Section Options, select the Create section for each object in loop and Display the object type in the section title check boxes to create a chapter or section for each model and include the object type in the title name.
Clear the Create link anchor for each object in loop check box.
3. In the middle pane, in the Simulink section, add a System Snapshot component.
4. In the left pane, select the Model Loop Chapter component. Then, in the middle pane, in the Formatting section, add a Paragraph component. In the left pane, the Paragraph component appears under the Model Loop Chapter component and above the System Snapshot component.
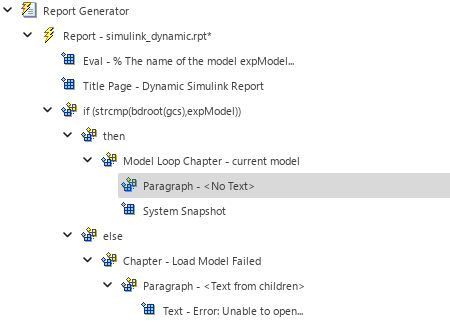
5. In the right pane, specify these properties for the Paragraph component:
Under Paragraph Text, enter:
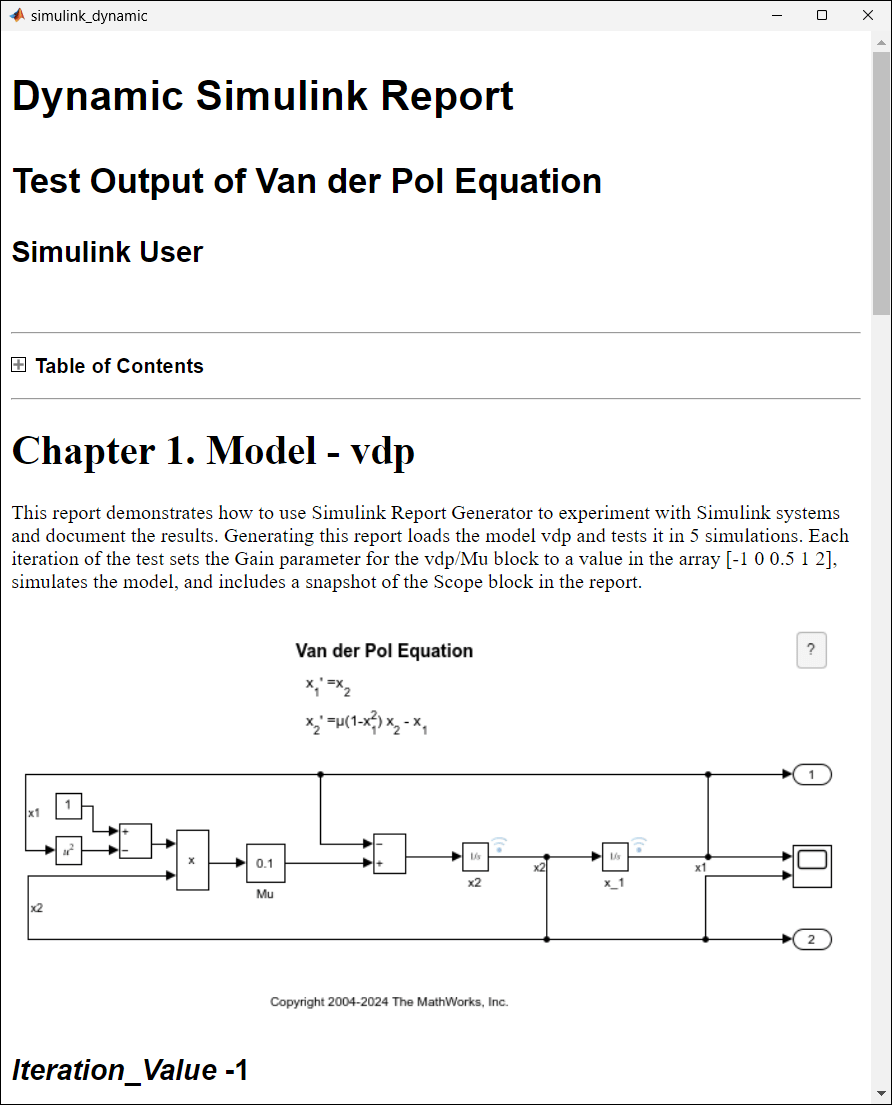
This report demonstrates how to use Simulink Report Generator to experiment
with Simulink systems and document the results. Generating this report loads
the model %<expModel> and tests it in %<length(expValue)> simulations. Each
iteration of the test sets the %<expParam> parameter for the %<expBlock>
block to a value in the array %<expValue>, simulates the model, and includes
a snapshot of the Scope block in the report.
Under Style, clear the Preserve white space checkbox.
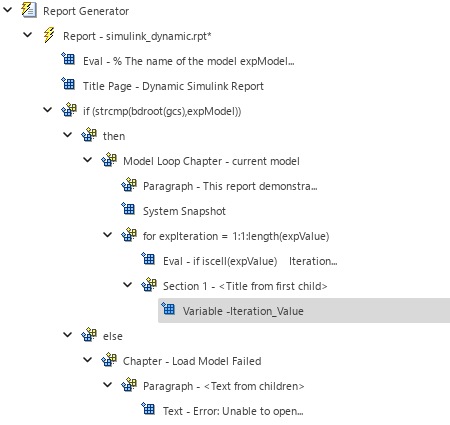
Create Section for Each Iteration
To change the Gain parameter for the Mu block several times, create a loop by using a For Loop component:
1. In the left pane, select the System Snapshot component.
2. In the middle pane, in the Logical and Flow Control section, add a For Loop component. Then, in the right pane, specify these properties:
Set End to
length(expValue). This expression calculates the number of Gain parameter values to test.Set Variable name to
expIteration. This variable acts as a loop index.
3. In the middle pane, in the MATLAB section, add an Evaluate MATLAB Expression. Then, in the right pane, specify these properties:
Clear the Insert MATLAB expression in report and Display command window output in report check boxes.
In the Expression to evaluate in the base workspace box, enter this MATLAB code, which saves the next parameter value as the variable
Iteration_Value:
if iscell(expValue)
   Iteration_Value = expValue{expIteration};
else
   Iteration_Value = num2str(expValue(expIteration));
end
Clear the Evaluate this expression if there is an error check box.
4. In the middle pane, in the Formatting section, add a Chapter/Subsection component. Then, in the right pane, for Title, select Automatic.
5. In the middle pane, in the MATLAB section, add an Insert Variable component into the report. Then, in the right pane, specify these properties:
Set Variable name to
Iteration_Value.Set Display as to
Inline text.
The left pane shows the for component as a sibling of the Paragraph and System Snapshot components, the Eval and Section 1 components as children of the for component, and the Variable component as a child of the Section 1 component.
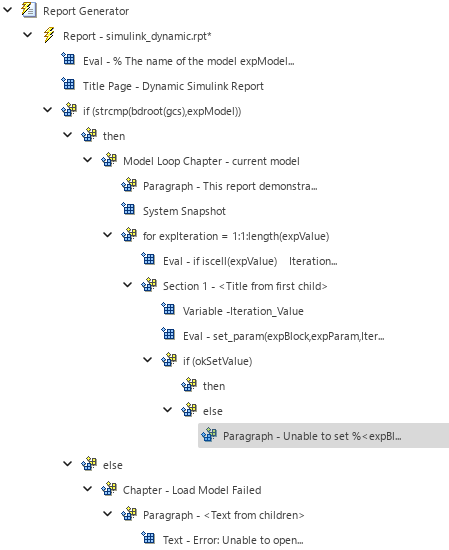
Set Block Parameter Value
For each iteration, set the value of the Gain parameter by using an Evaluate MATLAB Expression component:
1. In the left pane, select the Variable component.
2. In the middle pane, in the MATLAB section, add an Evaluate MATLAB Expression. Then, in the right pane, specify these properties:
Clear the Insert MATLAB expression in report and Display command window output in report check boxes.
In the Expression to evaluate in the base workspace box, enter this MATLAB code, which sets the value of the Gain parameter for the Mu block to the value of
Iteration_Value:
set_param(expBlock,expParam,Iteration_Value);
okSetValue = true;
In the Evaluate this expression if there is an error box, enter this code, which sets the value of
okSetValuetofalseif the command from the previous step fails:
okSetValue = false;
3. In the middle pane, in the Logical and Flow Control section, add a Logical If component to check the value of okSetValue. Then, in the right pane, set Test expression to okSetValue.
4. In the middle pane, in the Logical and Flow Control section, add a Logical Else component.
5. In the left pane, select the if component again. Then, in the middle pane, in the Logical and Flow Control section, add a Logical Then component. In the left pane, the then component appears above the else component.
6. In the left pane, select the else component.
7. In the middle pane, in the Formatting section, add a Paragraph component to display an error in the report if okSetValue is false. Then, in the right pane, specify these properties:
Under Title Options, select
Custom title. Then, in the box to the right, enterError.Under Paragraph Text, enter:
Unable to set %<expBlock> "%<expParam>" to value %<Iteration_Value>.
Under Style, clear the Preserve white space checkbox.
The left pane shows the Eval and if components as siblings of the Variable component, the then and else components as children of the if component, and the Paragraph component as a child of the else component.
Simulate Model and Test Signal Data
To simulate the model with the updated parameter value, add a Model Simulation component. Then, to test whether the signal data falls in the specified range, add another Logical If component:
1. In the left pane, select the then component.
2. In the middle pane, in the Simulink section, add a Model Simulation component. Then, in the right pane, specify these properties:
Clear the Use model's workspace I/O variable names check box.
Set Time to
dynamicT.Set States to
dynamicX.Set Output to
dynamicY.
3. In the middle pane, in the Simulink Blocks section, add a Scope Snapshot component to capture the simulation output for each iteration. Then, in the right pane, specify these properties:
Set Paper orientation to
Portrait.Set Image size to
[5 4].Set Scaling to
Use image size.
4. In the middle pane, in the Logical and Flow Control section, add a Logical If component to test the signal data. Then, in the right pane, set Test Expression to
max(dynamicX{2}.Values.Data)>testMin & max(dynamicX{2}.Values.Data)<testMax
5. In the middle pane, in the Formatting section, add a Paragraph component to report signal data that passed the test. Then, in the right pane, specify these properties:
Under Title Options, select
Custom title. Then, in the box to the right, enterSuccess.Under Paragraph Text, enter:
The conditioned signal has a maximum value
of %<max(dynamicX{2}.Values.Data)>, which lies
in the desired range between %<testMin> and
%<testMax>.
Under Style, clear the Preserve white space checkbox.
6. In the middle pane, in the MATLAB section, add an Evaluate MATLAB Expression. In the left pane, the Eval component appears as a child of the Paragraph component.
7. On the toolbar, use the Move Left button ![]() to make the Eval component a sibling of the Paragraph component.
to make the Eval component a sibling of the Paragraph component.
8. In the right pane, specify these properties for the Eval component:
Clear the Insert MATLAB expression in report and Display command window output in report check boxes.
In the Expression to evaluate in the base workspace box, enter this MATLAB code, which saves the signal values in the
expOkValuesarray:
expOkValues = [expOkValues; ...
    {Iteration_Value,max(dynamicX{2}.Values.Data)}];
In the Evaluate this expression if there is an error box, enter this code, which displays an error if the command from the previous step fails:
disp("Error during eval:"+evalException.message)
The left pane shows the Simulate model, Scope Snapshot, and if components as children of the then component, and the Paragraph and Eval components as children of the if component.
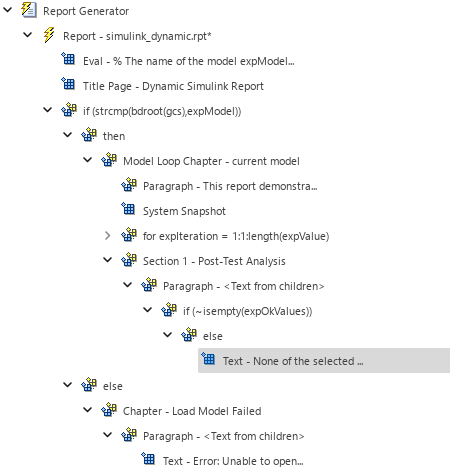
Create Post-Test Analysis Section
To report the parameter values that passed the test, add an Array-Based Table component inside a Chapter/Subsection component:
1. In the left pane, select the Model Loop Chapter component.
2. In the middle pane, in the Formatting section, add a Chapter/Subsection component. The new section appears at the beginning of the chapter.
3. On the toolbar, click the Move Down button ![]() three times to move the Section 1 component to the end of the Model Loop Chapter component.
three times to move the Section 1 component to the end of the Model Loop Chapter component.

4. In the right pane, for Title, select Custom. Then, in the box to the right, enter Post-Test Analysis.
5. In the middle pane, in the Formatting section, add a Paragraph component. Then, in the right pane, under Style, clear the Preserve white space checkbox.
6. In the middle pane, in the Logical and Flow Control section, add a Logical If component to check whether there are any signal values within the desired range. Then, in the right pane, set Test Expression to
~isempty(expOkValues)
7. In the middle pane, in the Logical and Flow Control section, add a Logical Else component. This component handles the case where no signal values fall within the designated range.
8. In the middle pane, in the Formatting section, add a Text component. Then, in the right pane, specify these properties:
In the Text to include in report box, enter:
None of the selected parameter values produced a maximum signal value
between %<testMin> and %<testMax>.
Under Style, clear the Preserve white space checkbox.
The left pane shows the Paragraph component as a child of the Section 1 component, the if component as a child of the Paragraph component, the else component as a child of the if component, and the Text component as a child of the else component.
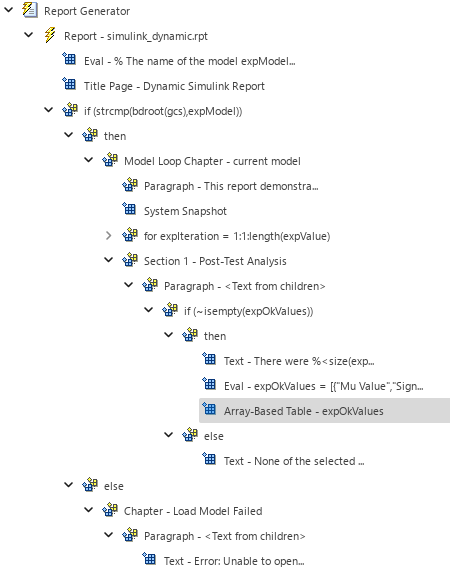
9. In the left pane, select the if component again. Then, in the middle pane, in the Logical and Flow Control section, add a Logical Then component to the report. In the left pane, the then component appears above the else component.
10. In the middle pane, in the Formatting section, add a Text component. Then, in the right pane, specify these properties:
In the Text to include in report box, enter:
There were %<size(expOkValues,1)> parameter values that produced
a maximum signal value between %<testMin> and %<testMax>.
Under Style, clear the Preserve white space checkbox.
11. In the middle pane, in the MATLAB section, add an Evaluate MATLAB Expression component. Then, in the right pane, specify these properties:
Clear the Insert MATLAB expression in report and Display command window output in report check boxes.
In the Expression to evaluate in the base workspace box, enter this MATLAB code, which creates an array with the table headers
"Mu Value"and"Signal Maximum":
expOkValues = [{"Mu Value","Signal Maximum"}; expOkValues];
In the Evaluate this expression if there is an error box, enter this code, which displays an error if the command from the previous step fails:
disp("Error during eval:"+evalException.message)
12. In the middle pane, in the Formatting section, add a Array-Based Table component. Then, in the right pane, specify these properties:
Set Workspace variable name to
expOkValues.Set Table title to
Valid Iteration Values.
The left pane shows the then component as a child of the if component, and the Text, Eval, and Array-Based Table components as children of the then component.
Generate Report
To generate the report, on the toolbar, click the Report button ![]() . While the report generates:
. While the report generates:
The left pane of the Report Explorer highlights each component of the report setup file as it executes.
The Message List window shows the progress of the report generation. To specify the level of detail you want the Message List window to display, use the drop-down list at the top of the window.
When processing finishes, the MATLAB Web browser opens and displays the HTML file.