obw
Occupied bandwidth
Syntax
Description
bw = obw(___,freqLims,p)Fs
or f. If the second input is passed as empty,
obw assumes a normalized frequency. This syntax
also specifies p as the percentage of the total signal
power contained in the occupied band.
obw(___) with no output arguments
plots the PSD or power spectrum in the current figure window and annotates
the bandwidth.
Examples
Generate 1024 samples of a chirp sampled at 1024 kHz. The chirp has an initial frequency of 50 kHz and reaches 100 kHz at the end of the sampling. Add white Gaussian noise such that the signal-to-noise ratio is 40 dB. Reset the random number generator for reproducible results.
nSamp = 1024;
Fs = 1024e3;
SNR = 40;
rng default

t = (0:nSamp-1)'/Fs;

x = chirp(t,50e3,nSamp/Fs,100e3);
x = x+randn(size(x))*std(x)/db2mag(SNR);
Estimate the occupied bandwidth of the signal and annotate it on a plot of the power spectral density (PSD).
obw(x,Fs)
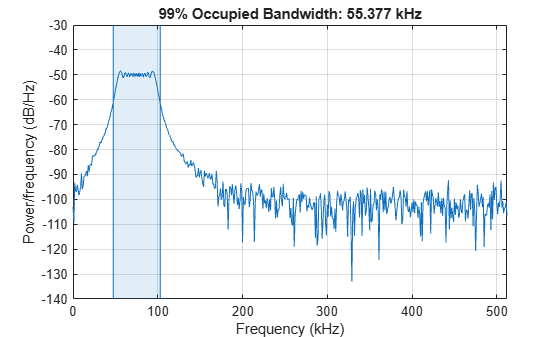
ans =
5.5377e+04
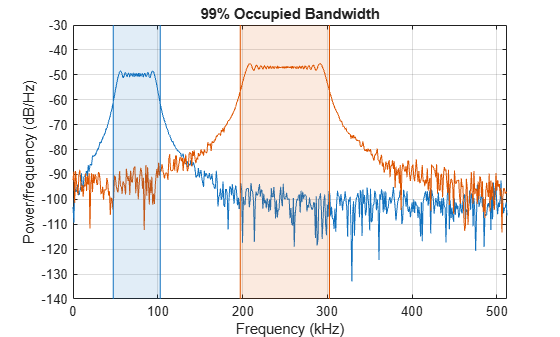
Generate another chirp. Specify an initial frequency of 200 kHz, a final frequency of 300 kHz, and an amplitude that is twice that of the first signal. Add white Gaussian noise.
x2 = 2*chirp(t,200e3,nSamp/Fs,300e3);
x2 = x2+randn(size(x2))*std(x2)/db2mag(SNR);
Concatenate the chirps to produce a two-channel signal. Estimate the occupied bandwidth of each channel.
y = obw([x x2],Fs)
y = 1×2
105 ×

    0.5538    1.0546
Annotate the occupied bandwidths of the two channels on a plot of the PSDs.
obw([x x2],Fs);
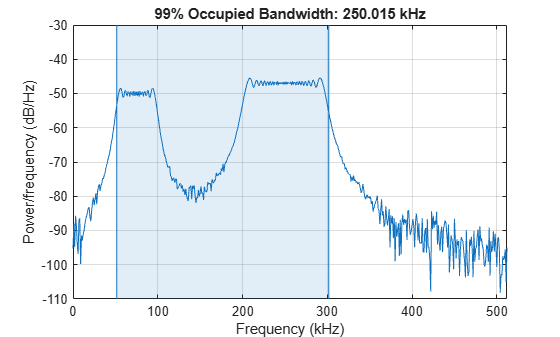
Add the two channels to form a new signal. Plot the PSD and annotate the occupied bandwidth.
obw(x+x2,Fs);
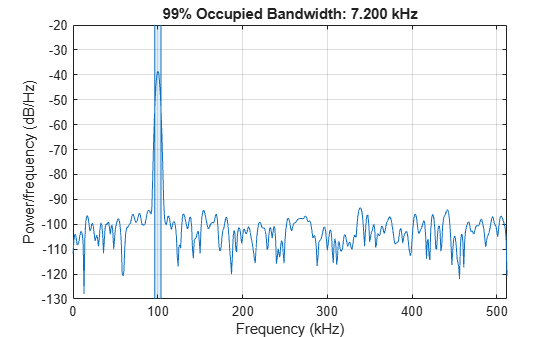
Generate 1024 samples of a 100.123 kHz sinusoid sampled at 1024 kHz. Add white Gaussian noise such that the signal-to-noise ratio is 40 dB. Reset the random number generator for reproducible results.
nSamp = 1024;
Fs = 1024e3;
SNR = 40;
rng default

t = (0:nSamp-1)'/Fs;

x = sin(2*pi*t*100.123e3);
x = x + randn(size(x))*std(x)/db2mag(SNR);
Use the periodogram function to compute the power spectral density (PSD) of the signal. Specify a Kaiser window with the same length as the signal and a shape factor of 38. Estimate the occupied bandwidth of the signal and annotate it on a plot of the PSD.
[Pxx,f] = periodogram(x,kaiser(nSamp,38),[],Fs);

obw(Pxx,f);
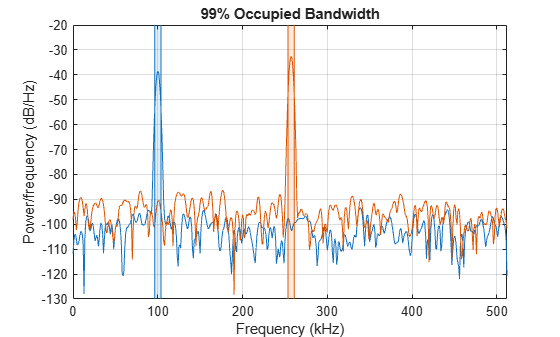
Generate another sinusoid, this one with a frequency of 257.321 kHz and an amplitude that is twice that of the first sinusoid. Add white Gaussian noise.
x2 = 2*sin(2*pi*t*257.321e3);
x2 = x2 + randn(size(x2))*std(x2)/db2mag(SNR);
Concatenate the sinusoids to produce a two-channel signal. Estimate the PSD of each channel and use the result to determine the occupied bandwidth.
[Pyy,f] = periodogram([x x2],kaiser(nSamp,38),[],Fs);

y = obw(Pyy,f)
y = 1×2
103 ×

    7.2001    7.3777
Annotate the occupied bandwidths of the two channels on a plot of the PSDs.
obw(Pyy,f);
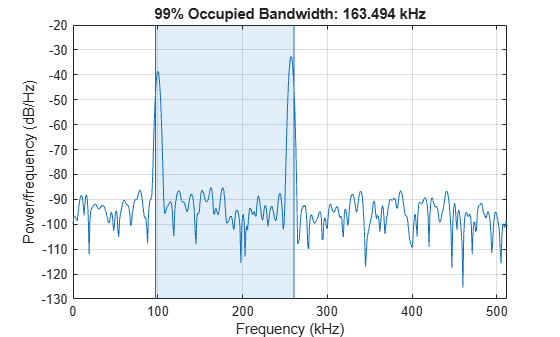
Add the two channels to form a new signal. Estimate the PSD and annotate the occupied bandwidth.
[Pzz,f] = periodogram(x+x2,kaiser(nSamp,38),[],Fs);

obw(Pzz,f);
Generate a signal whose PSD resembles the frequency response of an 88th-order bandpass FIR filter with normalized cutoff frequencies rad/sample and rad/sample.
d = fir1(88,[0.25 0.45]);
Compute the 99% occupied bandwidth of the signal between rad/sample and rad/sample. Plot the PSD and annotate the occupied bandwidth and measurement interval.
obw(d,[],[0.2 0.6]*pi);

Output the occupied bandwidth, its lower and upper bounds, and the occupied band power. Specifying a sample rate of is equivalent to leaving the rate unset.
[bw,flo,fhi,power] = obw(d,2*pi,[0.2 0.6]*pi);

fprintf('bw = %.3f*pi, flo = %.3f*pi, fhi = %.3f*pi \n',[bw flo fhi]/pi)
bw = 0.217*pi, flo = 0.240*pi, fhi = 0.458*pi
fprintf('power = %.1f%% of total',power/bandpower(d)*100)power = 99.0% of total
Add a second channel with normalized cutoff frequencies rad/sample and rad/sample and an amplitude that is one-tenth that of the first channel.
d = [d;fir1(88,[0.5 0.8])/10]';
Compute the 50% occupied bandwidth of the signal between rad/sample and rad/sample. Plot the PSD and annotate the occupied bandwidth and measurement interval.
obw(d,[],[0.3 0.9]*pi,50);
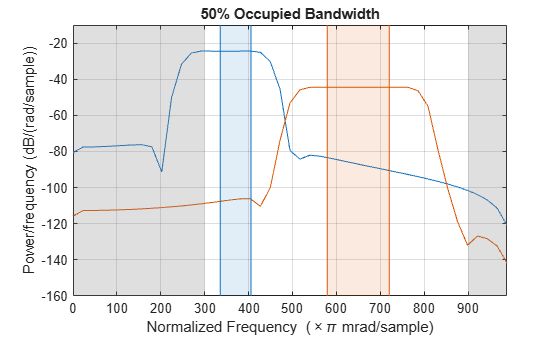
Output the occupied bandwidth of each channel. Divide by .
bw = obw(d,[],[0.3 0.9]*pi,50)/pi
bw = 1×2

    0.0705    0.1412
Input Arguments
Output Arguments
Algorithms
To determine the occupied bandwidth, obw computes a periodogram
power spectral density estimate using a rectangular window and integrates the estimate
using the midpoint rule. The occupied bandwidth is the difference in frequency between
the points where the integrated power crosses 0.5% and 99.5% of the total power in the
spectrum.
You can obtain the same value of the occupied bandwidth, bw,
from a signal x at a sample rate Fs in
these three ways.
| Directly from the signal |
bw = obw(x,Fs) |
| From the periodogram of the signal |
[P,F] = periodogram(x,[],length(x),Fs); bw = obw(P,F) |
| From the power spectral estimate (Welch's PSD) of the signal |
[P,F] = pwelch(x,rectwin(length(x)),[],length(x),Fs); bw = obw(P,F) |
Note
Because obw uses an intermediary representation
to transform the input signal from the time domain to frequency domain, the
returned occupied bandwidth might vary, depending on the signal transformation
method, number of DFT points, and window size.
Extended Capabilities
Version History
Introduced in R2015aSee Also
bandpower | periodogram | powerbw | plomb | pwelch