Determine Peak Widths
R2026bCreate a signal that consists of a sum of Gaussian curves. Specify the location, height, and width of each curve.
x = linspace(0,1,1000);

Pos = [1 1.5 3 5 7 8]'/10;
Hgt = [7 6.2 3 2 2 3]';
Wdt = [3 2.5 4 3 4 6]'/100;

y = sum(Hgt.*(exp(-((x-Pos)./Wdt).^2)),1);
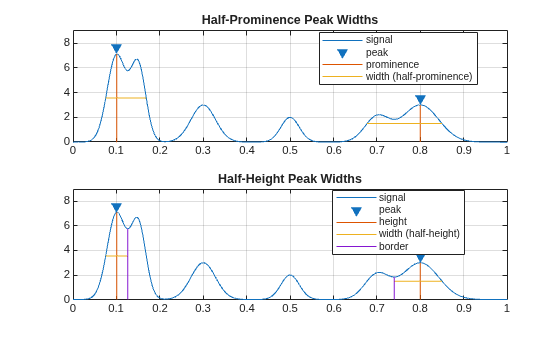
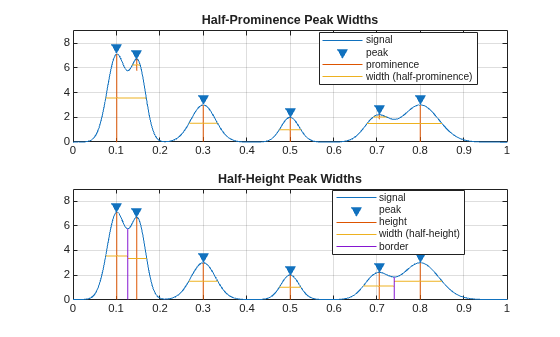
Measure the widths of the peaks using half prominence and half height as reference.
tiledlayout("flow")
ax11 = nexttile;
findpeaks(y,x,Annotate="extents")
title("Half-Prominence Peak Widths")
ax12 = nexttile;
findpeaks(y,x,Annotate="extents",WidthReference="halfheight")
title("Half-Height Peak Widths")
ylim([ax11 ax12],[0 9])
Set MinPeakDistance to 0.5 to select the tallest peaks separated by at least 0.5 units on the x-axis. Measure the widths of the peaks using half prominence and half height as reference. Only the first and last peaks satisfy the minimum separation condition, so the widths displayed in the plot correspond to these two peaks.
Note that each peak retains its width regardless of the specified conditions or whether it is selected as a consequence of these conditions.
figure
tiledlayout("flow")
ax21 = nexttile;
findpeaks(y,x,Annotate="extents",MinPeakDistance=0.5)
title("Half-Prominence Peak Widths")
ax22 = nexttile;
findpeaks(y,x,Annotate="extents",MinPeakDistance=0.5, ...
    WidthReference="halfheight")
title("Half-Height Peak Widths")
ylim([ax21 ax22],[0 9])