Main Content

removebyname

Remove simulation data by name from SimData object

Since R2020a

Description

[t,x,names] = removebyname(simdata,selectNames) returns the simulation time points t, the simulation data x, and corresponding names after removing the simulation data of model components specified by selectNames.

example

sdOut = removebyname(simdata,selectNames) returns the simulation results after removing the simulation data of model components specified by selectNames as a SimData object sdOut.

example

___ = removebyname(simdata,selectNames,'Format',formatValue) returns the simulation data in the specified data format.

example

Examples

collapse all

Load the model of glucose-insulin response. For details about the model, see the Background section in Simulate the Glucose-Insulin Response.

sbioloadproject('insulindemo.sbproj','m1');

Suppress an information warning that is issued during simulations.

warnSettings = warning('off', 'SimBiology:DimAnalysisNotDone_MatlabFcn_Dimensionless');

Simulate a single meal for a normal subject for 7 hours.

singleMeal = sbioselect(m1,'Name','Single Meal');
cs = getconfigset(m1,'active');
cs.StopTime = 7;
sd1 = sbiosimulate(m1,singleMeal)
 
   SimBiology Simulation Data
 
   ModelName:        Cobelli's Glucose-Insulin System
   Logged Data:
     Species:        15
     Compartment:    0
     Parameter:      24
     Sensitivity:    0
     Observable:     0
 
sbioplot(sd1);

Figure contains an axes object. The axes object with title States versus Time, xlabel Time, ylabel States contains 39 objects of type line. These objects represent Glucose appearance.Dose, Glucose appearance.Stomach Glu Solid, Glucose appearance.Stomach Glu Tritur, Glucose appearance.Stomach Glu, Glucose appearance.Gut Glu, Glucose appearance.Plasma Glu, Glucose appearance.Plasma Glu Conc, Glucose appearance.Tissue Glu, Insulin secretion.Interstitial Ins, Insulin secretion.Portal Ins, Insulin secretion.Liver Ins, Insulin secretion.Plasma Ins, Insulin secretion.Plasma Ins Conc, Insulin secretion.Ins Delay 1, Insulin secretion.Ins Delay 2, Stomach Glu After Dosing, a, c, kempt, kgri, Glu Appear Rate, Glu Prod, Plasma Glu Conc Rate, Ins Dep Glu Util, Glu Util, Glu Excretion, Glu Excretion Mode, Vm, Vmx, beta, Delayed Glu Signal, Delayed Glu Signal Mode, Ins Prod, Ins Prod Mode, Ins Secr, Basal Ins Secr, m3, Hepatic Extraction, Basal Glu Prod.

Remove all parameter data logged in the SimData object sd.

[t,x,names] = remove(sd1,{'Type','parameter'});

Remove all parameter data and return as a new SimData object.

sd2 = remove(sd1,{'Type','parameter'});
sbioplot(sd2);

Figure contains an axes object. The axes object with title States versus Time, xlabel Time, ylabel States contains 15 objects of type line. These objects represent Glucose appearance.Dose, Glucose appearance.Stomach Glu Solid, Glucose appearance.Stomach Glu Tritur, Glucose appearance.Stomach Glu, Glucose appearance.Gut Glu, Glucose appearance.Plasma Glu, Glucose appearance.Plasma Glu Conc, Glucose appearance.Tissue Glu, Insulin secretion.Interstitial Ins, Insulin secretion.Portal Ins, Insulin secretion.Liver Ins, Insulin secretion.Plasma Ins, Insulin secretion.Plasma Ins Conc, Insulin secretion.Ins Delay 1, Insulin secretion.Ins Delay 2.

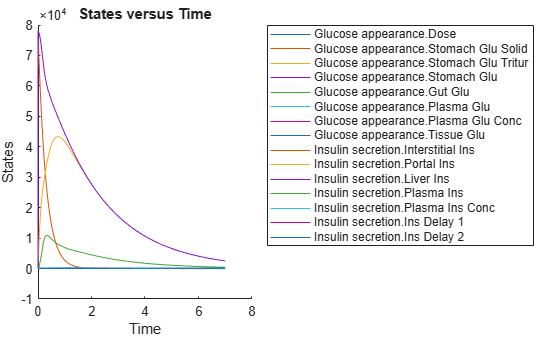
Remove the simulation data of a species by specifying its name.

sd3 = removebyname(sd2,["[Insulin secretion].[Ins Delay 2]"]);
sbioplot(sd3);

Figure contains an axes object. The axes object with title States versus Time, xlabel Time, ylabel States contains 14 objects of type line. These objects represent Glucose appearance.Dose, Glucose appearance.Stomach Glu Solid, Glucose appearance.Stomach Glu Tritur, Glucose appearance.Stomach Glu, Glucose appearance.Gut Glu, Glucose appearance.Plasma Glu, Glucose appearance.Plasma Glu Conc, Glucose appearance.Tissue Glu, Insulin secretion.Interstitial Ins, Insulin secretion.Portal Ins, Insulin secretion.Liver Ins, Insulin secretion.Plasma Ins, Insulin secretion.Plasma Ins Conc, Insulin secretion.Ins Delay 1.

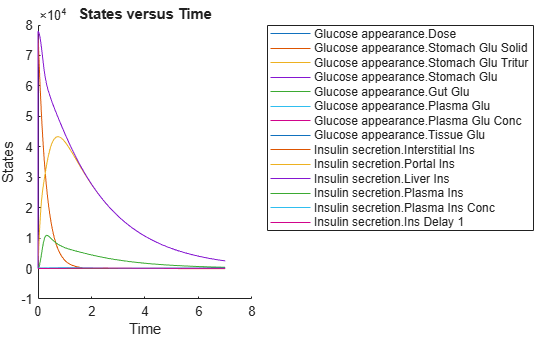
Restore the warning settings.

warning(warnSettings);

Input Arguments

collapse all

Simulation data, specified as a SimData object or array of SimData objects.

Names of states that you want to select data for, specified as a character vector, string, string vector, or cell array of character vectors.

Example: {'x1','x2','x3'}

Data Types: char | string | cell

Simulation data format, specified as a character vector or string. Some formats require you to specify only one output argument. The valid formats follow.

  • 'num' — This format returns simulation time points and simulation data in numeric arrays and the names of quantities and sensitivities as a cell array. This format is the default when you run getdata with multiple output arguments.

  • 'nummetadata' — This format returns a cell array of metadata structures instead of the names of quantities and sensitivities as the third output argument.

  • 'numqualnames' — This format returns qualified names in the third output argument to resolve ambiguities.

You must specify only one output argument for the following formats.

  • 'simdata' — This format returns data in a new SimData object or an array of SimData objects. This format is the default when you specify a single output argument.

  • 'struct' — This format returns a structure or structure array that contains both data and metadata.

  • 'ts' — This format returns data as a cell array.

    • If simdata is scalar, the cell array is an m-by-1 array, where each element is a timeseries object. m is the number of quantities and sensitivities logged during the simulation.

    • If simdata is not scalar, the cell array is k-by-1, where each element of the cell array is an m-by-1 cell array of timeseries objects. k is the size of simdata, and m is the number of quantities or sensitivities in each SimData object in simdata. In other words, the function returns an individual time series for each state or column and for each SimData object in simdata.

  • 'tslumped' — This format returns the data as a cell array of timeseries objects, combining data from each SimData object into a single time series.

Output Arguments

collapse all

Simulation time points, returned as a numeric vector or cell array. If simdata is scalar, t is an n-by-1 vector, where n is the number of time points. If simdata is an array of objects, t is a k-by-1 cell array, where k is the size of simdata.

Simulation data, returned as a numeric matrix or cell array. If simdata is scalar, x is an n-by-m matrix, where n is the number of time points and m is the number of quantities and sensitivities logged during the simulation. If simdata is an array of objects, x is a k-by-1 cell array, where k is the size of simdata.

Names of quantities and sensitivities logged during the simulation, returned as a cell array. If simdata is scalar, names is an m-by-1 cell array. If simdata is an array of objects, names is a k-by-1 cell array, where k is the size of simdata.

Simulation results, returned as a SimData object.

Version History

Introduced in R2020a