Diagnostic Viewer
View, compare, and diagnose errors and warnings generated by Simulink models
Description
Use the Diagnostic Viewer to view and analyze the diagnostic messages generated by a Simulink® model. A model generates these diagnostic messages during various run-time operations, such as model load, simulation, build, or update diagram. The Diagnostic Viewer displays the diagnostic messages as errors, warnings, and information. When you modify the model and simulate it again, new diagnostic messages can be added or removed. You can identify these differences in the diagnostic messages using the Comparator in the Diagnostic Viewer and analyze how different conditions or parameters affect the model.
The Diagnostic Viewer enables you to:
View diagnostic messages.
Filter, search, save, copy, or group diagnostic messages.
Fix errors and warnings by using suggested actions.
Identify the sources of errors in a model.
Suppress or restore diagnostic messages.
Provide feedback to improve diagnostic messages.
Compare diagnostic messages from different run-time operations.
Save diagnostic messages from a specific operation to use as a baseline for comparisons with diagnostic messages from future operations.
Viewer Toolbar
Manage diagnostic messages using the Viewer available in the Diagnostic Viewer toolbar.
| Action | |
|---|---|
| The time and stages appear in a drop-down list. To view the diagnostic messages specific to a stage, select a stage from the drop-down list. |
| Click to save the diagnostic details from a specific stage as a baseline file in JSON format. |
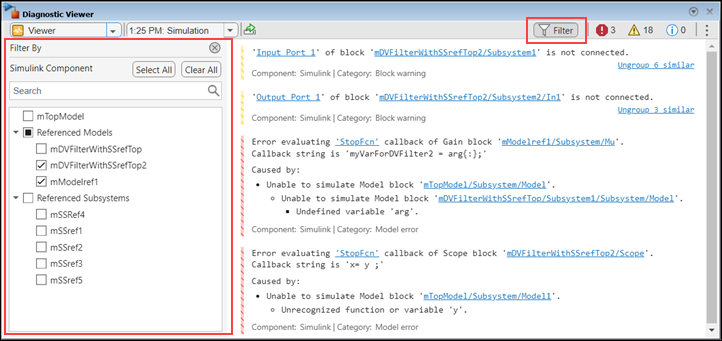
| Click to open the Filter by pane to filter diagnostics based on model components. Click again to close the pane. |
| Click to hide all error messages. Click again to view. |
| Click to hide all warning messages. Click again to view. |
| Click to hide all information messages. Click again to view. |
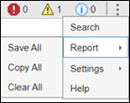
| Enter keywords to search specific messages. |
| Save, copy, or clear all the diagnostic messages using
the To save or copy the messages for a selected stage, right-click anywhere inside the Diagnostic Viewer. |
| Group warnings with the same message ID. |
Comparator Toolbar
Compare diagnostic messages from different run-time operations of a model using the Comparator available in the Diagnostic Viewer toolbar.
| Action | |
|---|---|
| Select two stages to compare from the drop-down menus. If you have previously saved baseline files, you can import them to use for comparison. |
| Count of the diagnostic messages that are added and removed. Select to view the details of the added error and warning messages. |
| Copy the comparison report to the clipboard in text or JSON format. |
Diagnostic Message Pane
View the diagnostic messages in the diagnostic message pane of the Diagnostic Viewer. The diagnostic message pane displays the error, warning, and information messages for a selected stage. Each stage represents a run-time operation, such as model load, simulation, build, or diagram update. As more operations occur, new stages are created. For cases involving multiple operations, child stages are created to form a hierarchical structure.
These diagnostic messages are color-coded for quick identification:
 — Errors
 — Warnings
 — Errors encountered during model load. Any
subsequent operations, such as model update without addressing these high priority
warning messages, are marked as errors.
 — Information
When you point to a diagnostic message, you get the options to copy a diagnostic message
or provide feedback. To copy a diagnostic message, click the copy icon
![]() . To provide feedback, click the add comment icon
. To provide feedback, click the add comment icon
![]() and enter your suggestions to improve the diagnostic
message in the text box. The character limit of the feedback is 1024 characters.
and enter your suggestions to improve the diagnostic
message in the text box. The character limit of the feedback is 1024 characters.
Note
Use the feedback box to provide suggestions on diagnostic messages. To request help or report technical bugs, contact Technical Support at Contact Support.
Suggested Actions
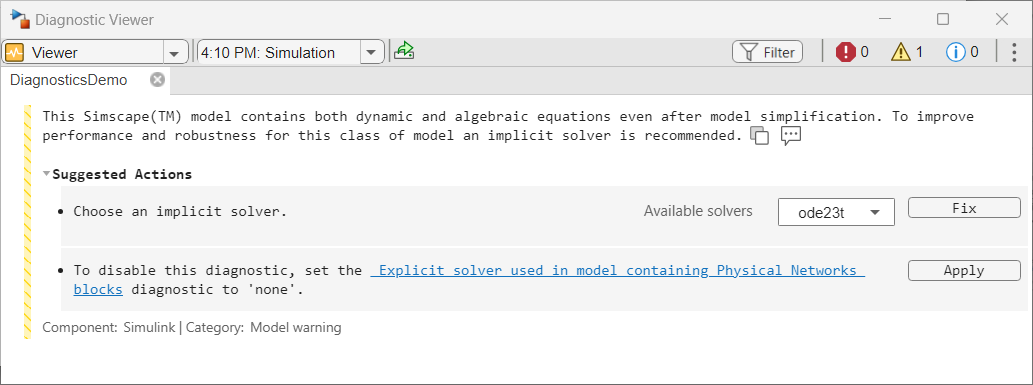
You may fix the errors and warnings generated during a run-time operation using the suggested actions. For errors and warnings that have a predefined fix, Diagnostic Viewer displays Suggested Actions.
A diagnostic message can have multiple fixes and suggestions.
Fix — Use a suggested fix to automatically rectify the error. Each fix is associated with a Fix button. In some cases, you can also provide values before applying the fix.
Once a fix is successfully applied, the Fix button for the diagnostic message is no longer available. If a fix was unsuccessful, the Diagnostic Viewer displays a failure message.
Suggestion — Use the suggestions for the errors and warnings that cannot be automatically fixed.
Open the Diagnostic Viewer
In the Simulink toolstrip, select Debug > Diagnostics, and then select Diagnostic Viewer.
You can use the Diagnostic Viewer in two ways:
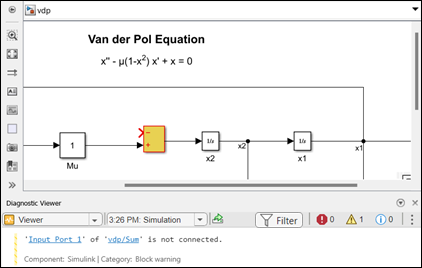
Standalone — Displays diagnostic messages of all the models in a separate window with one tab for each model.
Docked with model window — Displays the diagnostic messages specific to a model.
To dock the Diagnostic Viewer to a model, in the Debug tab of the toolstrip, select Diagnostics, and then select Docked Diagnostic Viewer. Alternatively, in the Modeling tab of the toolstrip, select Environment > Simulink Settings. In the Simulink Settings dialog box, select Editor > Use docked Diagnostic Viewer.
Note
Setting the Diagnostic Viewer as docked with model or standalone is a system-wide operation. The setting applies to all models.


