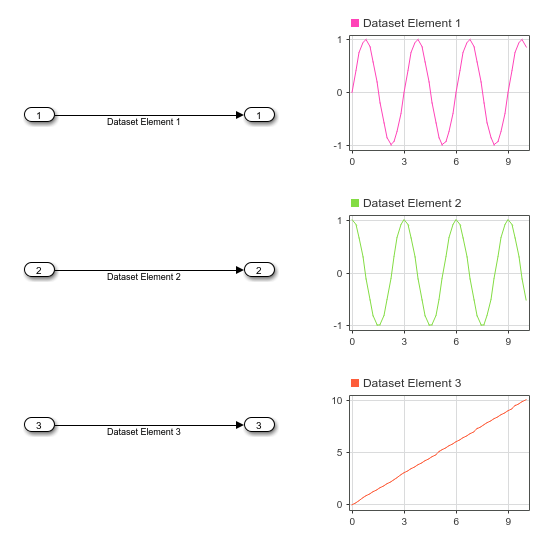
Create data for three simulation input signals and group them in a Dataset object. A simple model loads the contents of the Dataset object using three root-level Inport blocks. Dashboard Scope blocks in the model display each signal created using the loaded input data.
First, create the signal data to load into the model. Use the expression in this example to create the evenly-spaced time vector for an input signal, especially when modeling discrete input signals. MATLAB® supports several other methods for creating an evenly-spaced vector, but other methods can introduce double-precision rounding errors in the time data, which can lead to unexpected simulation results.
Create signal data for a sine signal, a cosine signal, and a linear signal.
Create a timeseries object to contain the data for each signal. Give each timeseries object a descriptive name so signals are easy to identify once they are grouped in the Dataset object.
Create a Dataset object and use the addElement function to add each timeseries object to the Dataset object.
inputData =
Simulink.SimulationData.Dataset 'inputData' with 3 elements

                             Name         BlockPath
                             ___________  _________
    1  [1x1 timeseries]      Sine Wave    ''
    2  [1x1 timeseries]      Cosine Wave  ''
    3  [1x1 timeseries]      Line         ''

  - Use braces { } to access, modify, or add elements using index.
When you load external input data using root-level Inport blocks, you specify the data to load using the Input parameter in the Model Configuration Parameters on the Data Import/Export pane. Open the model LoadInputDataset and see that the Input parameter is specified as inputData.
Simulate the model. The Dashboard Scope block connected to the first Inport block shows the sine signal, the Dashboard Scope block connected to the second Inport block shows the cosine signal, and the Dashboard Scope block connected to the third Inport block shows the linear signal.
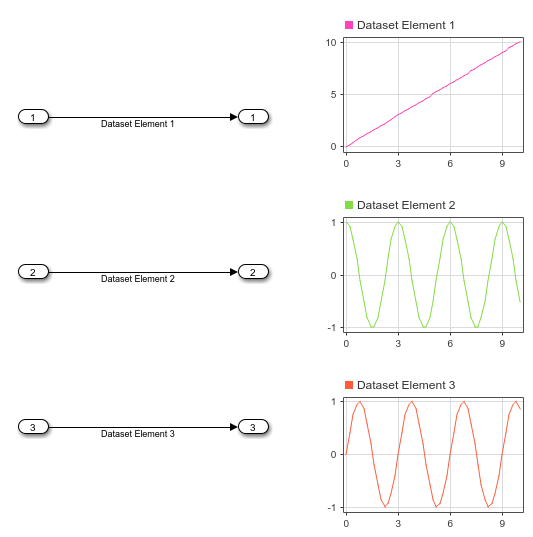
You can swap the order of elements in the Dataset object and see the change reflected in how the elements are mapped to the Inport blocks.
inputData =
Simulink.SimulationData.Dataset 'inputData' with 3 elements

                             Name         BlockPath
                             ___________  _________
    1  [1x1 timeseries]      Line         ''
    2  [1x1 timeseries]      Cosine Wave  ''
    3  [1x1 timeseries]      Sine Wave    ''

  - Use braces { } to access, modify, or add elements using index.
Simulate the model again. The Dashboard Scope block that displays the first element now shows the line, and the Dashboard Scope block that displays the third element shows the sine wave, reflecting the new order of elements in the Dataset object.

