Create Freehand Signal Data Using Mouse or Multi-Touch Gestures
Freehand signal data is data that you add graphically. Signal Editor allows you to add
freehand signal data using a mouse or touchscreen (if available and supported). While using
a touchscreen, use common multi-touch gestures such as tap, pan, pinch, and double-tap
(select all). By default, freehand signal data is in timeseries
format.
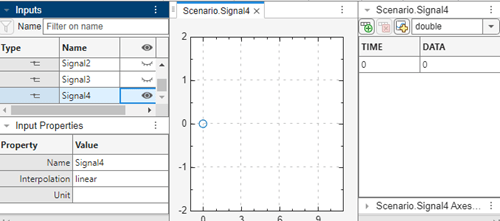
To add freehand signal data, in the Signal Editor tab, create a
signal and double-click ![]() . In the Edit tab, click
. In the Edit tab, click ![]() and remove the second point on the plot.
and remove the second point on the plot.

You can draw your own signal lines or points, use MATLAB® expressions to enter data, move signal lines or points across the canvas, take an image of the lines of the canvas, and add the data to the Signal Editor.
To create signal data, in the Edit section:
Insert a single data point by clicking Point and then clicking in the graph area. If you add additional points, the tool connects the points.
Insert a signal line by clicking Line and then clicking in the graph area. To extend the line, click the endpoints of the line and draw the extension.
Tip
When you insert signals or signal lines, the canvas adds a shaded area bound by the leftmost and rightmost endpoints. While in Insert Line mode, you cannot add more points within this shaded area. You add additional line points outside the shaded area.
Draw a signal freehand by clicking Draw.
Draw a signal using MATLAB expressions by clicking Expression (
 , Ctrl+E). Enter time and data
values that create signal points that are scalars or vectors whose number of points
match the time points.
To select or move signal data, in the Signal section:
Select a point or line by clicking Select and then selecting the point or area to be selected.
Move a point or line by clicking Move.
To edit or remove the signal data, in the Edit section:
Change the data of a point by clicking Edit Point. In the Edit Point dialog box, enter the new Time and Data values. These values must be scalar.
To work with the canvas, use the tools in the Align, Show, and Zoom sections.
Snap the canvas graph to various grids using the tools in the Align section. Snapping to a grid helps you better control data accuracy while drawing signals. For example, consider snapping to the x-grid to uniformly sample signal values or snapping to the y-grid to control the amplitude of a ramp signal.
To toggle the display of data points, grid lines, and data markers in the canvas, use the commands in the Align and Show sections. To zoom in and out of the canvas, see Zoom & Pan. These actions are touchscreen-supported with the pan and pinch gestures. For more information, see Create Signals and Signal Data.
To capture an image of the signal data, in the Capture section, click
Screenshot (![]() ). In the Save a screenshot dialog box, specify a name and
graphic type for the file.
). In the Save a screenshot dialog box, specify a name and
graphic type for the file.
For an example of how to add a freehand ramp signal, see Draw a Ramp Using Snap to Grid for Accuracy.