How Simulink Profiler Captures Performance Data
How Simulink Profiler Works
The Simulink Profiler captures performance data while your model simulates. It identifies the parts of your model that require the most time to simulate. Use the profiling information to decide where to focus your model optimization efforts.
Note
The Simulink Profiler does not support rapid accelerator simulation.
Simulink® stores performance data in the simulation profile report. The data shows the time spent executing each function in your model.
The basis for the Simulink Profiler is an execution model that this pseudocode summarizes.
Sim()
	ModelInitialize().
	ModelExecute()
		for t = tStart to tEnd
		Output()
		Update()
		Integrate()
			Compute states from derivs by repeatedly calling:
				MinorOutput()
				MinorDeriv()
			Locate any zero crossings by repeatedly calling:
				MinorOutput()
				MinorZeroCrossings()
		EndIntegrate
		Set time t = tNew.
	EndModelExecute
	ModelTerminate
EndSim
According to this conceptual model, Simulink runs a model by invoking the following functions zero, one, or many times, depending on the function and the model.
| Function | Purpose | Level |
|---|---|---|
sim | Simulate the model. This top-level function invokes the other functions required to simulate the model. The time spent in this function is the total time required to simulate the model. | System |
ModelInitialize | Set up the model for simulation. | System |
ModelExecute | Execute the model by invoking the output, update, integrate, etc., functions for each block at each time step from the start to the end of simulation. | System |
Output | Compute the outputs of a block at the current time step. | Block |
Update | Update the state of a block at the current time step. | Block |
Integrate | Compute the continuous states of a block by integrating the state derivatives at the current time step. | Block |
MinorOutput | Compute block output at a minor time step. | Block |
MinorDeriv | Compute the state derivatives of a block at a minor time step. | Block |
MinorZeroCrossings | Compute zero-crossing values of a block at a minor time step. | Block |
ModelTerminate | Free memory and perform any other end-of-simulation cleanup. | System |
Nonvirtual Subsystem | Compute the output of a nonvirtual subsystem at the current time step by invoking the output, update, integrate, etc., functions for each block that it contains. The time spent in this function is the time required to execute the nonvirtual subsystem. | Block |
The Simulink Profiler measures the time required to execute each invocation of these functions. After the model simulates, the Simulink Profiler generates a report that describes the amount of simulation time spent on each function.
Start Profiler
Open the model.
In the Simulink Editor, on the Debug tab, click the Performance button arrow and select Simulink Profiler.

Run a profiling simulation. On the Profile tab that opens, click Profile.
When simulation is complete, the Simulink Profiler generates and displays the simulation profile for the model in a panel in the Simulink Editor.
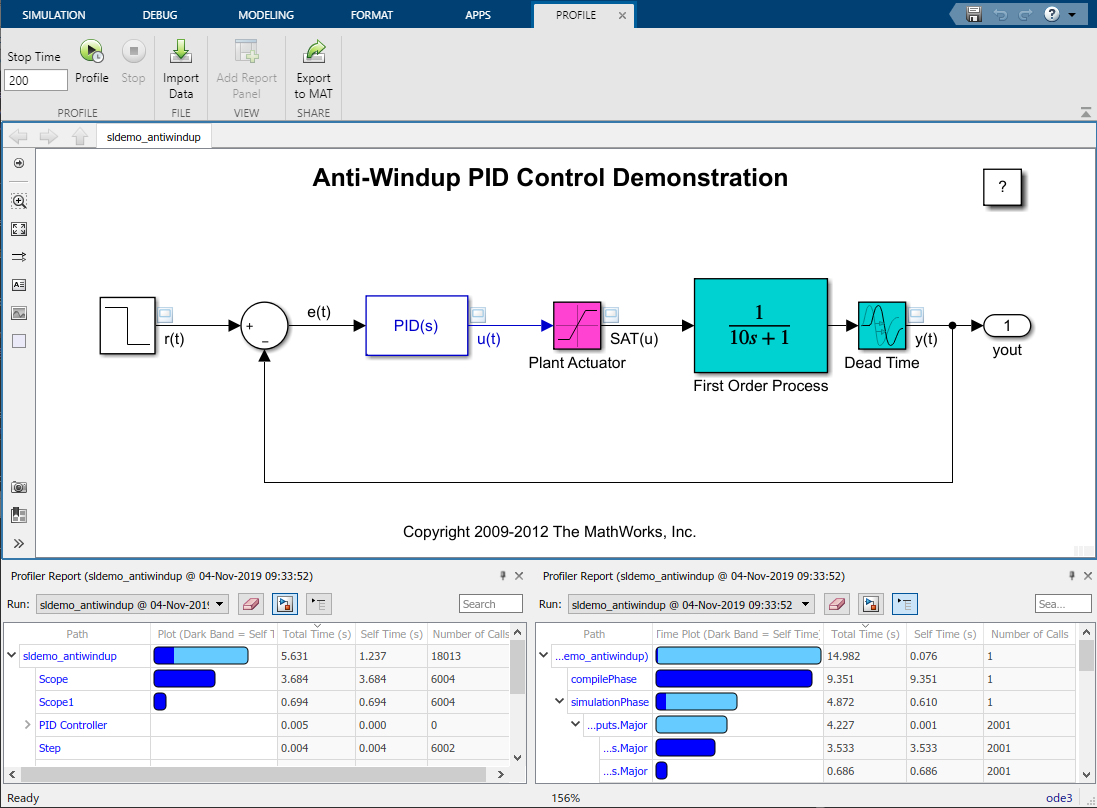
Block Hierarchy View
The block hierarchy view of the report presents the profiling information of the model in a nested tree form. The first row of the table—which is the top of the tree—corresponds to the entire model. Subsequent rows at the first level of nesting correspond to blocks at the root level of the model.

Execution Stack View
The execution stack view breaks down the profiling report by simulation phase of the model. The main simulation phases of a model are compilation, initialization, simulation, and termination. For a more detailed explanation of simulation phases, see Simulation Phases in Dynamic Systems.

Save Profiler Results
You can save the Profiler report to a mat file. At a later time,
you can import and review the report by either loading the saved mat
file to the current workspace or import it into an existing profiler session.
To save a profiling report, select Export to MAT in the
Share section of the Profile tab and
optionally specify a name for the mat file.
To view a saved report in an open profiling session in the Simulink editor, select Import from File in the Profile tab.
To view a saved report in the command line, load the MAT file that contains the report. The
profiling information is loaded into the current workspace as a Simulink.profiler.Data object.