Collect Code Testing Metrics Programmatically
This example shows how to programmatically assess the status and quality of code testing activities in a project. You can assess the testing status of a unit by using the metric API to collect metric data on the test status and coverage results. After collecting metric results, you can access the results or export them to a file. By running a script that collects these metrics, you can automatically analyze the testing status of your project to, for example, design a continuous integration system. Use the results to monitor testing completeness or to detect downstream testing impacts when you make changes to artifacts in the project.
Run Model and Code Tests
Open a project that contains models and testing artifacts. For this example, in the MATLAB® Command Window, enter:
openExample("slcheck/ExploreTestingMetricDataInModelTestingDashboardExample");
openProject("cc_CruiseControl");
ToolOutputTracking property as true in
the digitalthread.settings. For information, see Monitor Artifact Traceability and Detect Outdated Results with Digital Thread.For this example, run a test case in Normal mode and then in
Software-in-the-loop (SIL) mode by
entering:
cp = currentProject;
rf = cp.RootFolder;
tf = fullfile(rf,"tests","cc_DriverSwRequest_Tests.mldatx");
tfObj = sltest.testmanager.load(tf);
tsObj = getTestSuites(tfObj);
tcObj = getTestCases(tsObj);
tc3 = tcObj(3);
run(tc3,SimulationMode='Normal');
run(tc3,SimulationMode='Software-in-the-loop (SIL)');
Collect Metric Results for Software Units in Project
Create a metric.Engine object for the current
project.
metric_engine = metric.Engine();
Update the trace information for metric_engine to reflect
pending artifact changes and to track the test results.
updateArtifacts(metric_engine);
Create an array of metric identifiers for the metrics you want to collect. For
this example, create a list of the metric identifiers used in the SIL Code Testing
dashboard by specifying the Dashboard as
"ModelUnitSILTesting". For more information, see getAvailableMetricIds.
metric_Ids = getAvailableMetricIds(metric_engine,...
App="DashboardApp",...
Dashboard="ModelUnitSILTesting");
Execute the metric engine to collect the metric results.
execute(metric_engine,metric_Ids);
ArtifactScope argument. For more information, see execute.Access Results
After you collect metric results, you can access the results programmatically or generate a report for offline review.
View Test and Coverage Results Programmatically
To access the results programmatically, use the getMetrics function. The function returns the
metric.Result objects that contain the result data for
the specified unit and metrics. For this example, store the results for the
metrics slcomp.sil.TestStatusDistribution and
slcomp.sil.CoverageBreakdown in corresponding
arrays.
results_silTests = getMetrics(metric_engine,"slcomp.sil.TestStatusDistribution");
results_silCoverage = getMetrics(metric_engine,"slcomp.sil.CoverageBreakdown");
The metric slcomp.sil.TestStatusDistribution returns a
distribution of the number of tests that passed, failed, were disabled, not run,
or were untested. For this example, the distribution values for the unit
cc_DriverSwRequest were in
results_silTests(4).Value. The order of the units in your
results might be different on your
machine.
results_silTests(4).Value
ans =

  struct with fields:

       BinCounts: [5×1 double]
        BinEdges: {5×1 cell}
    OverallCount: 10
Ratios: [5×1 double]disp function to display the
bin counts of the distribution, which are fields in the Value
field of the metric.Result
object.disp(['Unit: ',results_silTests(4).Scope(1).Name]) disp([' ',num2str(results_silTests(4).Value.BinCounts(1)),' SIL tests failed']) disp([' ',num2str(results_silTests(4).Value.BinCounts(2)),' SIL tests passed']) disp([' ',num2str(results_silTests(4).Value.BinCounts(3)),' SIL tests disabled']) disp([' ',num2str(results_silTests(4).Value.BinCounts(4)),' SIL tests not run']) disp([' ',num2str(results_silTests(4).Value.BinCounts(5)),' SIL tests untested'])
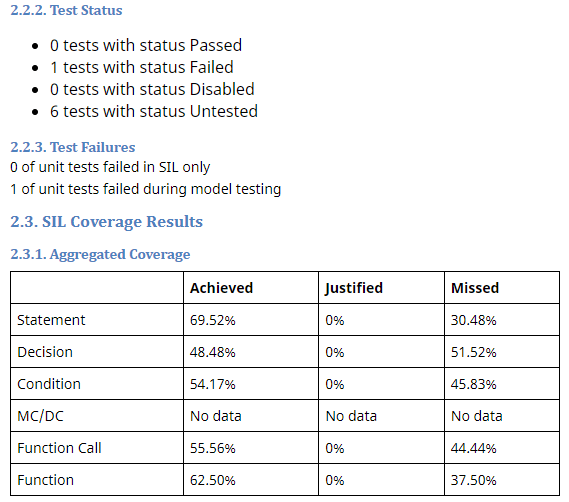
Unit:  cc_DriverSwRequest
 0 SIL tests failed
 1 SIL tests passed
 0 SIL tests disabled
 9 SIL tests not run
 0 SIL tests untested
cc_DriverSwRequest, one SIL test failed and six SIL tests
have not run. For code testing results to be compliant, each of the tests should
have passed. If one or more tests have not run, or are untested, disabled, or
failed, those issues should be addressed before you analyze the code coverage
results. For information on how to address the test failure in this example
project, see Identify and Troubleshoot Gaps in Code Testing Results and Coverage.The metric slcomp.sil.CoverageBreakdown returns the
percentage of coverage achieved, justified, completed, or missed for each
coverage type. For this example, the coverage results for the unit
cc_DriverSwRequest were in
results_silCoverage(4):
results_silCoverage(4).Value
ans =

  struct with fields:

       Statement: [1×1 struct]
        Decision: [1×1 struct]
       Condition: [1×1 struct]
            MCDC: [1×1 struct]
        Function: [1×1 struct]
FunctionCall: [1×1 struct]Value field of the metric.Result
object. For example, to access the SIL decision coverage results for the
unit:decisionCoverage = results_silCoverage(4).Value.Decision
decisionCoverage =

  struct with fields:

               Achieved: 48.4848
              Justified: 0
                 Missed: 51.5152
AchievedOrJustified: 48.4848cc_DriverSwRequest, so far the
SIL tests achieved 48% of decision coverage and missed 52% of decision coverage.
For code coverage results to be compliant, 100% of test results for each
coverage type should either be achieved or justified. When the coverage results
for each coverage type have either been achieved or justified, the dashboard
considers the coverage to be completed.Generate Report for Offline Review
Generate a report file that contains the SIL testing results for each of the
units in the project. For this example, specify the HTML file format, use pwd to provide the path to the current
folder, and name the report
"SILResultsReport.html".
reportLocation = fullfile(pwd, "SILResultsReport.html");
generateReport(metric_engine,Type="html-file",Location=reportLocation,Dashboard="ModelUnitSILTesting");
To open the table of contents and navigate to results for each unit, click the menu icon in the top-left corner of the report. For each unit in the report, there is a summary of the SIL test results and coverage results.
For more information on the report, see generateReport.
Saving the metric results in a report file allows you to access the results without opening the project and the dashboard. Alternatively, you can open the dashboard to see the results and explore the artifacts. In the MATLAB Command Window, enter:
modelTestingDashboard
See Also
metric.Engine | execute | generateReport | getAvailableMetricIds | updateArtifacts